Tag Archives: alpha-architect

Visualizing Stock Market Risk: 7/1926 To 6/2015

Summary How crazy is current market action? Not that crazy. Seeing a -3%+ or a +3% observation is roughly a 1/100 event, or ~ 2.5 times a year. Obviously, return events are not independent and volatility tends to cluster, but the numbers above establish a basic starting point for discussions about daily return action. Clearly, if you can’t handle volatility, you shouldn’t be in the stock market. By Wesley R. Gray How crazy is current market action? Not that crazy. …and if you lived through 2008, definitely not that crazy. Seeing a -3%+ or a +3% observation is roughly a 1/100 event, or ~ 2.5 times a year. Obviously, return events are not independent and volatility tends to cluster, but the numbers above establish a basic starting point for discussions about daily return action. Here we present daily total return data from the Ken French library : Value-weight return of all CRSP firms incorporated in the US and listed on the NYSE, AMEX, or NASDAQ that have a CRSP share code of 10 or 11 (essentially ordinary common shares). There are 23,509 daily return in total. Daily Return Distribution: (click to enlarge) Here are the specific stats: Bucket Observations Frequency Cumulative -5.00% 59 0.25% 0.25% -4.50% 20 0.09% 0.34% -4.00% 31 0.13% 0.47% -3.50% 46 0.20% 0.66% -3.00% 85 0.36% 1.03% -2.50% 164 0.70% 1.72% -2.00% 289 1.23% 2.95% -1.50% 547 2.33% 5.28% -1.00% 1154 4.91% 10.19% -0.50% 2566 10.91% 21.10% 0.00% 5599 23.82% 44.92% 0.50% 7048 29.98% 74.90% 1.00% 3416 14.53% 89.43% 1.50% 1331 5.66% 95.09% 2.00% 563 2.39% 97.49% 2.50% 237 1.01% 98.49% 3.00% 115 0.49% 98.98% 3.50% 69 0.29% 99.28% 4.00% 61 0.26% 99.54% 4.50% 37 0.16% 99.69% 5.00% 19 0.08% 99.77% More 53 0.23% 100.00% How about drawdowns? Daily returns are one thing – let’s review the top 30 stock market drawdowns over the past 90+ years. Rank Date Start Date End VW_CRSP 1 8/30/1929 6/30/1932 -83.67% 2 10/31/2007 2/28/2009 -50.37% 3 2/27/1937 3/31/1938 -49.18% 4 12/31/1972 9/30/1974 -46.46% 5 8/31/2000 9/30/2002 -45.09% 6 11/30/1968 6/30/1970 -33.56% 7 8/31/1987 11/30/1987 -29.91% 8 8/31/1932 2/28/1933 -28.47% 9 5/31/1946 5/29/1947 -23.85% 10 12/31/1961 6/30/1962 -23.06% 11 1/31/1934 7/31/1934 -18.34% 12 8/31/1933 10/31/1933 -17.95% 13 4/30/2011 9/30/2011 -17.71% 14 6/30/1998 8/31/1998 -17.39% 15 5/31/1990 10/31/1990 -16.97% 16 11/30/1980 7/31/1982 -16.62% 17 1/31/1966 9/30/1966 -15.45% 18 7/31/1957 12/31/1957 -14.95% 19 4/30/2010 6/30/2010 -12.99% 20 1/31/1980 3/31/1980 -11.98% 21 8/31/1978 10/31/1978 -11.95% 22 6/30/1983 5/31/1984 -10.83% 23 3/31/2000 5/31/2000 -9.64% 24 12/31/1976 2/28/1978 -9.33% 25 7/31/1956 2/28/1957 -8.37% 26 8/31/1986 9/30/1986 -8.15% 27 3/31/1936 4/30/1936 -8.02% 28 12/31/1959 10/31/1960 -7.97% 29 6/30/1943 11/30/1943 -7.76% 30 1/31/1994 6/30/1994 -7.60% And here are the numbers outlined on a chart: (click to enlarge) Clearly, if you can’t handle volatility , you shouldn’t be in the stock market. Original Post Share this article with a colleague

One Way To Beat The Market? Be Different!

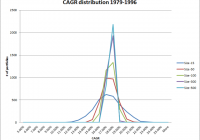
By Yang Xu This study was inspired by Ben Carlson’s blog post a few months ago. Ben highlights Robert Hagstrom’s book “The Warren Buffett Portfolio.” The high level question is the following: How can one beat the market? Answer: To beat the market, you have to be different than the market. One simple way to do this is to hold a small number of stocks. But is this naive approach a good bet? Experiment Setup: Each month, we select the largest 1,000 U.S. stocks to form our universe. We then randomly form portfolios as follows: Portfolio with 15 stocks Portfolio with 50 stocks Portfolio with 100 stocks Portfolio with 300 stocks Portfolio with 500 stocks Every month, we create 3,000 portfolios for each of the 5 perturbations listed above. The idea is to randomly select either 15, 50, 100, 300 or 500 stocks from the universe of 1,000 stocks. However, in order to simulate a large number of possibilities, we create 3,000 portfolios (for all 5 selections above) every month! So on 12/31/1978, we create: 3,000 portfolios of 15 stocks 3,000 portfolios of 50 stocks 3,000 portfolios of 100 stocks 3,000 portfolios of 300 stocks 3,000 portfolios of 500 stocks The portfolio returns are equal-weighted. We repeat this process every month. So in total, we have 3,000 draws of the 5 portfolios across time. Results to the 3,000 draws of the 5 portfolios are shown below: Simulation results (1/1/1979 – 12/31/1996): CAGR by Size of Portfolio (click to enlarge) The results are hypothetical results and are NOT an indicator of future results and do NOT represent returns that any investor actually attained. Indexes are unmanaged, do not reflect management or trading fees, and one cannot invest directly in an index. Additional information regarding the construction of these results is available upon request. Takeaway: Notice that the smaller the portfolio size, the more variance in the portfolio returns (fat tails); the larger the portfolio size, there is less variance in the portfolio returns. Here are the baseline statistics: CAGR buckets by Size of Portfolio The results are hypothetical results and are NOT an indicator of future results and do NOT represent returns that any investor actually attained. Indexes are unmanaged, do not reflect management or trading fees, and one cannot invest directly in an index. Additional information regarding the construction of these results is available upon request. Takeaway: The larger the portfolio, the smaller the chance of high performance. Summary Statistics: The results are hypothetical results and are NOT an indicator of future results and do NOT represent returns that any investor actually attained. Indexes are unmanaged, do not reflect management or trading fees, and one cannot invest directly in an index. Additional information regarding the construction of these results is available upon request. Takeaway: Smaller portfolios have higher highs (max) and lower lows (min), as well as a higher standard deviation. Percentage of Time the Portfolio Beats S&P 500 EW Portfolio: The results are hypothetical results and are NOT an indicator of future results and do NOT represent returns that any investor actually attained. Indexes are unmanaged, do not reflect management or trading fees, and one cannot invest directly in an index. Additional information regarding the construction of these results is available upon request. Takeaway: Smaller portfolios (15, 50 and 100 stocks) can sometimes beat the market (S&P 500 EW). However, the small portfolios lose more often than they win! Let’s examine the results over the second time period. Simulation results (1/1/1997 – 12/31/2014): CAGR by Size of Portfolio (click to enlarge) The results are hypothetical results and are NOT an indicator of future results and do NOT represent returns that any investor actually attained. Indexes are unmanaged, do not reflect management or trading fees, and one cannot invest directly in an index. Additional information regarding the construction of these results is available upon request. Takeaway: Similar to the first half of the sample – the smaller the portfolio size, the more variance in the portfolio returns (fat tails); the larger the portfolio size, there is less variance in the portfolio returns. Here are the baseline statistics: The results are hypothetical results and are NOT an indicator of future results and do NOT represent returns that any investor actually attained. Indexes are unmanaged, do not reflect management or trading fees, and one cannot invest directly in an index. Additional information regarding the construction of these results is available upon request. Takeaway: Smaller portfolios have higher highs (max) and lower lows (min), as well as a higher standard deviation (same as our prior analysis). CAGR buckets by Size of Portfolio The results are hypothetical results and are NOT an indicator of future results and do NOT represent returns that any investor actually attained. Indexes are unmanaged, do not reflect management or trading fees, and one cannot invest directly in an index. Additional information regarding the construction of these results is available upon request. Takeaway: The larger the portfolio, the smaller the chance of high performance (again). Percentage of Time the Portfolio Beats S&P 500 EW Portfolio: The results are hypothetical results and are NOT an indicator of future results and do NOT represent returns that any investor actually attained. Indexes are unmanaged, do not reflect management or trading fees, and one cannot invest directly in an index. Additional information regarding the construction of these results is available upon request. Takeaway: Smaller portfolios (15, 50 and 100 stocks) can sometimes beat the market (S&P 500 EW). However, the small portfolios still lose more often than they win! Conclusion: The results above show that while selecting smaller portfolios of stocks, one can beat the market more often than with a larger portfolio. However, if randomly selecting a smaller portfolio of stocks , the investor will lose more often than they win! Is all hope lost? We also believe that in an effort to beat the market, you have to be different (concentrated portfolios), but also use security selection . We prefer 2 anomalies (Value and Momentum): Security selection based on Value Security selection based on Momentum If trying to beat the market, leverage the security selection models to form your smaller portfolios! Original Post

Market Timing With Value And Momentum

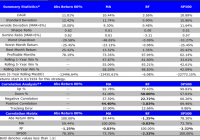
By Jack Vogel, Ph.D. Yesterday, we wrote a post showing a potential way to time the market using valuation-based signals. In the past, we have also examined how to use momentum-based signals (moving average rules and time-series momentum) to time the market. A natural question is, what happens when we combine the valuation-based signals with the momentum-based signals? Here at Alpha Architect, we are big believers in Value and Momentum . We have written about how to combine Value and Momentum in the security selection process here and here . In this post, we examine what happens when we combine valuation-based (value) signals with momentum-based (MA rule) signals. Here is the setup, from yesterday’s post: Strategy Background: We use 1/CAPE as the valuation metric, or the “earnings yield,” as a baseline indicator; however, we adjust the yield value for the realized year-over-year (yoy) inflation rate by subtracting the year-over-year inflation rate from the rate of 1/CAPE. To summarize, the metric looks as follows if the CAPE ratio is 20 and realized inflation (Inf) is 3%: Real Yield Spread Metric = (1/20)-3% = 2% Some details: The Bureau of Labor Statistics (BLS) publishes the CPI on a monthly basis since 1913; however, the data is one-month lagged (possibly longer). For example, the CPI for January won’t be released until February. So when we subtract the year-over-year inflation rate from the rate of 1/CAPE, we do 1-month lag to avoid look-ahead bias. We use the S&P 500 Total Return index as a buy-and-hold benchmark. So the two signals we will use are the following: Valuation-based signal: 80th Percentile Valuation-based asset allocation: Own the S&P 500 when valuation < 80th percentile, otherwise hold risk-free. In other word, if last month's CAPE valuation is in the 80 percentile or higher (data starting 1/1924), buy U.S. Treasury bills (Rf); otherwise stay in the market. Momentum-based signal: Long-term moving average rule on the S&P 500 (Own the S&P 500 if above the 12-month MA, risk-free if below the 12-month MA). The results are gross of any fees. All returns are total returns, and include the reinvestment of distributions (e.g., dividends). Indexes are unmanaged, do not reflect management or trading fees, and one cannot invest directly in an index. Our backtest period is from 1/1/1934 to 12/31/2014. Baseline Results: Here we show the results for 4 portfolios: Valuation-based market timing: Own the S&P 500 when valuation < 80th percentile, otherwise hold risk-free. Momentum-based market timing: Own the S&P 500 if above the 12-month MA, risk-free if below the 12-month MA. Risk-free: Total return to owning U.S. Treasury bills. SP500: Total return to the S&P 500. (click to enlarge) The results are hypothetical, are NOT an indicator of future results, and do NOT represent returns that any investor actually attained. Indexes are unmanaged, do not reflect management or trading fees, and one cannot invest directly in an index. Additional information regarding the construction of these results is available upon request. As previously noted, both Valuation and Momentum-based timing models increase Sharpe and Sortino ratios, while decreasing drawdowns. Now, let's combine them. Combining Value and Momentum Timing models: Here we show the results for 4 portfolios: (50/50) Abs 80%, MA : Each month, allocate 50% of capital to the valuation-based timing model and 50% or capital to the momentum-based allocation model. (and) Abs 80%, MA: Each month, examine the valuation and momentum-based signals. If both say "yes" to being in the market, invest in the S&P 500; if either or both say "no" to being in the market, invest in risk-free. (or) Abs 80%, MA: Each month, examine the valuation and momentum-based signals. If either says "yes" to being in the market, invest in the S&P 500; if both say "no" to being in the market, invest in risk-free. SP500: Total return to the S&P 500. (click to enlarge) The results are hypothetical, are NOT an indicator of future results, and do NOT represent returns that any investor actually attained. Indexes are unmanaged, do not reflect management or trading fees, and one cannot invest directly in an index. Additional information regarding the construction of these results is available upon request. Takeaways: Combining the Value and Momentum-based signals makes sense when using the "50/50 model" and the "(or) model." Both of these have higher Sharpe and Sortino ratios compared to standalone value and momentum-based models. The "(and) model" does not work very well - you are out of the market too often. Conclusion: Of course, transaction costs and taxes (not shown in the results above) need to be considered. However, it appears that combing Value and Momentum in market timing is promising, and something we will examine more carefully in the future. Original Post