Tag Archives: alerts

A Revelation For Small-Cap Investing Strategies

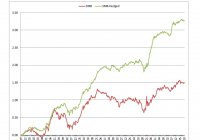
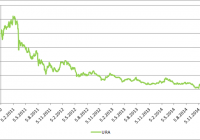
Suddenly, business as usual for small-cap investing is in need of a makeover, thanks to a new research paper (a landmark study for asset pricing) that revisits, reinterprets and ultimately revives the case for owning these shares – after controlling for quality, i.e., “junk”. Cliff Asness of AQR Capital Management and several co-authors have dissected the small-cap effect anew and discovered that there is a statistically robust small-cap premium across time after all, but only for companies that aren’t wallowing in financial trouble of one kind or another. The paper’s title says it all: ” Size Matters, If You Control Your Junk .” At the very least, the study will reframe the way the investment community thinks about small-cap investing, perhaps leading to a new generation of ETFs in this space with freshly devised benchmarks. Does that mean that the enigma of the small-cap premium has been solved? Let’s put it this way: suddenly, the topic looks a lot less cryptic. For those who haven’t been keeping up-to-date on the strange case of the on-again, off-again small-cap premium, a growing pool of research has raised doubts about this risk factor. Although there was much rejoicing in the years following the influential 1981 paper by Rolf Banz ( “The Relationship between Return and Market Value of Common Stocks” ) – the study that effectively launched the industry of small-cap investing – the pricing anomaly has fallen on hard times in recent years. As Asness et al. advise: Considering a long sample of U.S. stocks and a broad sample of global stocks, we confirm the common criticisms of the standard size factor: a weak historical record in the U.S. and even weaker record internationally makes the size effect marginally significant at best, long periods of poor performance, concentration in extreme, difficult to invest in microcap stocks, concentration of returns in January, absent for measures of size that do not rely on market prices, and subsumed by proxies for illiquidity. This is old news, of course. What’s new is the finding that “controlling for quality/junk reconciles many of the empirical irregularities associated with the size premium that have been documented in the literature and resurrects a larger and more robust size effect in the data.” In other words, the small-cap factor is alive and kicking, but it requires some tweaking in how we think about this slice of equities, namely, by focusing on comparatively “high-quality” firms. In summary, controlling for junk produces a robust size premium that is present in all time periods, with no reliably detectable differences across time from July 1957 to December 2012, in all months of the year, across all industries, across nearly two dozen international equity markets, and across five different measures of size not based on market prices. The critical issue is that small-caps generally are populated with a relatively high share of “junky” firms. Whereas large firms tend to be of higher quality – defined by, say, profits or earnings stability – there’s a wider spectrum of dodgy operations among smaller firms. That’s not surprising, but it does have major implications for how we think about expected return in this corner of the equity market. It’s puzzling that no one’s documented this previously, at least not as thoroughly and convincingly as Asness and company have. In any case, the results speak loud and clear: if you’re intent on carving out a dedicated allocation to the small-cap factor, you’re well advised to do so by focusing on relatively high-quality firms in this realm of the capitalization spectrum. Keep in mind, too, that the findings don’t conflict with the value factor, although here too there may be a bit more clarity in the wake of the paper. In fact, the authors “find that accounting for junk explains why small growth stocks underperform and small value stocks outperform the Fama and French (1993, 2014) models.” Ultimately, the numbers speak volumes. The new paper slices and dices the data from several perspectives, and it’s worth the time to read through the details to understand how this study revises our understanding of small-cap investing. “Overall, there is a weak size effect, whose variation over time and across seasons is substantial, as documented in the literature,” the researchers write. The smoking gun is that the case for small-caps looks much stronger when sidestepping the junkiest firms. A graph from the paper summarizes the point. Indeed, the difference between the cumulative investment return for the conventional definition of small-cap (SMB, or small minus big) vs. the proxy defined by Asness et al. (SMB-Hedged) is quite stark over the past half century. (click to enlarge) The paper’s discovery amounts to an important revelation for asset pricing, and arguably something more substantial for investors who toil in the small-cap waters. In short, it seems that small-cap strategies, as currently designed, are in need of revising, perhaps dramatically so, depending on the portfolio, ETF or mutual fund. Yes, Virginia, there is a small-cap premium, but to harvest it in a meaningful way, we’ll have to rethink how we invest in these companies.

Gold-In-Euro-Terms ETF Capitalizes On ECB’s QE Plan

Summary Gold is falling after ECB’s bond purchasing plan. Stronger USD is weighing on gold. However, bullion investors can use a euro-denominated gold ETF to hedge the depreciating value of the EUR. Gold exchange traded funds rose on a knee-jerk reaction Thursday, following the European Central Bank’s aggressive bond-purchasing plan, as traders anticipated a rise in inflation. However, investors soon realized that the ECB actions would benefit the dollar or weigh on USD-denominated bullion. The SPDR Gold Trust ETF (NYSEArca: GLD ) has increased 10.3% year-to-date but was down 0.9% Friday and again Monday. Gold strengthened Thursday after traders assumed the ECB’s quantitative easing would flood the market with cash and induce inflationary pressures, but many soon realized that the money created were euros and not dollars. Since the ECB’s announcement, the euro continued to depreciate toward an 11-year low against the U.S. dollar. Consequently, the stronger USD should hurt gold as it becomes costlier for foreign traders to acquire USD-denominated assets. “What you saw was uncertainty about what the ECB was going to do-I think that’s what lifted gold higher. But I think now that this is all going to kind of settle down,” Anthony Grisanti of GRZ Energy, said on CNBC . “I don’t understand why you would think something that would strengthen our dollar would strengthen gold at this point.” Alternatively, gold ETF traders can take a look at the AdvisorShares Gartman Gold/Euro ETF (NYSEArca: GEUR ) , an actively managed ETF tracking gold in euro terms. While GLD dipped Friday, GEUR gained 1.2%. “Holding gold in a non-U.S. dollar denominated currency may help to limit the downside risk during stressed market environments where the U.S. dollar becomes a safe haven store of value,” according to AdvisorShares . Some gold investors quickly picked up on the GEUR trade as well, with the Gold/Euro ETF trading volume up to 65,000 late Friday, or more than 10 times its average daily volume, according to Morningstar data. Looking at the futures market, COMEX gold traded down 0.7% to $1,291.6 per ounce late Friday, whereas Euro Spot gold rose 0.5% to €1,151.1 per ounce. AdvisorShares Gartman Gold/Euro ETF (click to enlarge) Full disclosure: Tom Lydon’s clients own shares of GLD.

The Uranium Bull Is Still Alive, But Paralyzed By The Oil Price Collapse

Summary The uranium sector was negatively impacted by the oil price collapse. The Global X Uranium ETF has recorded a new historical low. The decline is exaggerated and panic driven. Japan announced that it will restart its nuclear reactors, uranium price started to grow and the Global X Uranium ETF (NYSEARCA: URA ) rebounded strongly from its historical lows. It was early November and it seemed that the uranium sector found its bottom and the bright future is finally on the horizon. Then the URA price started to tank again and it has created new historical lows in January 2015 (chart below). But the uranium bull isn’t dead. The bull was just temporarily paralyzed by the collapse of oil prices. (click to enlarge) Source: own processing The most important thing that happened in the energy markets during the last quarter was the collapse of oil prices. The WTI price declined from $90.74 on October 1 to $48.5 on January 16. It represents a 46% decline. It had a negative effect on the whole energy sector, uranium companies including. The chart below shows the development of WTI and URA prices. The URA share price was declining along with the WTI price back in October. The relation changed in early November when the Japanese decision to restart its nuclear reactors spurred a short-lived rally of uranium prices and the whole uranium sector represented by URA as well. But the impact of collapsing oil prices proved out to be too strong. The URA share price started to decline again although the decline started to slow down slightly in December. Source: own processing The URA share price is strongly correlated with the WTI price most of the time. The chart below shows that there were time periods of almost perfect positive correlation during the last quarter. Some short periods of weak negative correlation were recorded only during the first half of November and in the end of December. (click to enlarge) Source: own processing Although URA has created a historical low in the beginning of 2015, the uranium price is still significantly above its summer lows (chart below). The current uranium price of $36.5 per pound is on the December 2013 levels. The URA share price was approximately $14 back then. It means that the current decline of URA is exaggerated and panic driven. Source: futures.tradingcharts.com Conclusion The decline of the Global X Uranium ETF share price seems to be exaggerated and panic driven. The uranium sector was significantly affected by the oil price collapse but the favorable uranium market fundamentals remain. Oil and uranium are not direct substitutes. Oil is mainly used for production of fuels and plastics while the main usage of uranium is to produce electricity. As soon as the markets realize that the bullish uranium fundamentals are still at play, the price of uranium and related securities including the Global X Uranium ETF will start to grow regardless of the oil price development. Now that you’ve read this, are you Bullish or Bearish on ? Bullish Bearish Sentiment on ( ) Thanks for sharing your thoughts. Why are you ? Submit & View Results Skip to results » Share this article with a colleague