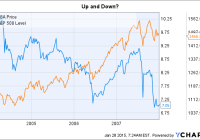
Summary CEFs are great at paying distributions for those seeking income. That said, some CEFs appear to be “too good” at this increasingly desirable trait. What is a sustainable distribution and when should you worry? Try this case study on for size. Closed-end funds, or CEFs, are great at providing investors income, something that most other pooled investment vehicles don’t do as well. However, there’s a fine line between providing investors a nice yield and drawing down net asset value, or NAV, to sustain what might really be an unsustainable distribution. If you are looking to buy and hold a CEF, at what point should you worry about the yield? A tale of two managed distributions How much is too much? That’s a tough question to answer across the entire closed-end fund universe because CEFs do so many different things in so many different ways. For example, a high-yield bond CEF’s distribution is inherently different from a short-term municipal bond CEF’s distribution. And both are different from a stock CEF’s distribution. So, the first thing to consider when looking at CEFs is to make sure you are comparing apples to apples. And that includes taking into consideration such things as leverage and option strategies. That said, let’s look at two funds that are exactly the same in all respects. Fund One has a 10% managed distribution policy, whereby it pays out 2.5% of its NAV every quarter. Fund Two has a 6% managed distribution policy, paying 1.5% of its NAV every quarter. What do the distributions look like? Over a four-year period in a generally rising market, Fund One’s NAV started out at $9.13 a share and ended at $8.07 a share. Over that span, it paid $0.15 a share from income it received, $2.85 from capital gains, and $0.54 from return of capital. Despite the fact that the broader market was heading generally higher over the span, Fund One lost over $1.00 a share in NAV. True, it paid investors handsomely via distributions, but its distribution policy was leading to a shrinking NAV. Fund Two, meanwhile, over a four-year span with a generally rising market, watched its NAV rise from $4.21 a share to $5.35. Over the four years it paid out $0.84 in distributions from income, nothing from capital gains, and $0.44 in return of capital. But, the NAV increased by a touch over $1.00 a share. Note that the market was moving generally higher through both four-year spans. In other words, Fund Two was able to grow its NAV at a time when you would expect it to be growing its NAV – something that Fund One didn’t achieve. The big reveal! The biggest difference between Fund One and Fund Two was their distribution policies, because both funds are the Liberty All-Star Equity Fund (NYSE: USA ). The first set of data came from January 2004 to December 2007, when it had a 10% distribution policy in place. The second set of data came from January 2009 to December 2012 when the fund had shifted to a 6% distribution policy. That move took place in early 2009 . USA data by YCharts USA data by YCharts I chose those end dates specifically because I wanted to track generally rising markets and avoid the disastrous performance the fund had in 2008. In that year, the fund’s NAV fell from $8.07 a share to $4.21. Distributions in 2008 were $0.07 from income and $0.58 from return of capital. Essentially, almost 90% of that year’s distribution was return of capital. It was a rough year for almost all investors and investments, to be sure. And Liberty All-Star Equity Fund wasn’t alone in dipping into capital to maintain its distribution. However, it isn’t a coincidence that the managed distribution plan was adjusted a year later in 2009. According to the fund’s board of directors, The change was adopted primarily to better align the Fund’s distribution rate with historical equity market returns. What does that mean? Historically, the stock market has returned roughly 10% or so a year, on average. If a CEF pays out 10% of its NAV every year, it is, essentially, returning everything that an investor might reasonably expect it to make – every year. That requires the CEF to beat the market in order to increase NAV. Fall short and the NAV will fall, which is pretty much what happened for “Fund One.” If, instead, the target is 6%, the CEF has a cushion. It can fall short of the market’s long-term average return and not eat into NAV when it pays distributions. Moreover, if it does better than 6%, it can actually grow its NAV over time. This is the benefit that “Fund Two” enjoyed above. To be fair, the markets in both periods were very different. And the fund uses a collection of outside mangers, which change over time. So there are factors beyond the distribution policy that impacted performance in both periods. However, this is as close as I think you can get to apples and apples in the investing world. It depends Of course this is just one example from what is, generally speaking, an unremarkable fund. For example, Liberty All-Star Equity Fund underperformed the S&P 500 Index by roughly three percentage points over each of the trailing 3-, 5-, and 10-year periods through year end 2014 on a total return basis (which includes distributions), according to Morningstar. But, it provides food for thought when looking at CEFs with big yields. You need to ask yourself if the level is sustainable over time. That’s particularly true for distributions that are at the complete discretion of the board of directors. In fact, target percentages are easier to deal with in some ways because they will, inherently, adjust up and down as the fund’s NAV and performance change over time. Good years you’ll get more, bad years you’ll get less. A static distribution based on what is, essentially, the board’s whim, will result in increasingly larger yields when the market is heading south and can set up dividend cuts. Of course, there are a host of other factors involved in deciding what CEFs to buy and which ones to avoid. Premiums and discounts, asset class, investment policy, etc. But, if you are looking for income, Liberty All-Star Equity Fund is a good case study in the difference that distribution choices can have on NAV. When all is said and done, the moral of the story is to think long and hard before you simply chase a yield in CEF land.

