Tag Archives: agriculture

ETF Deathwatch For August 2015: 330 And Climbing

Eleven ETFs and ETNs came off of ETF Deathwatch this month because they are no longer with us. Five more escaped because they were able to show a sustained improvement in their health, although the two iShares ETFs in this category are scheduled to close in August. Even with these sixteen departures, the overall list has four more members than last month. The reason for this growth is the twenty new names being added. The ETF Deathwatch for August consists of 330 products (240 ETFs and 90 ETNs). Historically, the number of ETFs and ETNs on Deathwatch have shown strong correlation to new ETF launch activity. The theory behind this is simple: a large number of new ETFs coming to market must compete against the other new products as well as the established base. Even the above-average performers may fail to attract attention, as investors find it more and more difficult to stay abreast of current offerings. As launch activity dwindles and overall ETF assets grow, many of the better products begin to take hold and weaker ones close, forcing the quantity of products on Deathwatch to decrease. As with many economic realities, it comes down to supply and demand. If this historical relationship holds, then I expect the size of the ETF Deathwatch list to continue growing in 2015 since launch activity is on pace to be the third strongest year ever. Meanwhile, closure activity is on pace to set a new record, and hundreds more are not profitable for their sponsors and should be closed. I expect the next large wave of additions to ETF Deathwatch will be many of the recently hatched currency-hedged ETFs. As detailed in ETF Stats for July 2015 – Currency Hedging Jumps The Shark , the quantity of currency-hedged ETFs surged from 16 to 57 since the beginning of 2014. By the time August comes to a close, the number will be even higher. I suspect many of these funds will find their way to Deathwatch due to either lack of investor awareness or lagging performance when the dollar rally fades. The average asset level of products on ETF Deathwatch decreased from $6.9 million to $6.8 million, but the quantity of products with less than $2 million in assets rose from 57 to 62. The average age fell from 50.3 months to 49.7 months, although the number of products more than five years old increased from 105 to 110. Here is the Complete List of 330 Products on ETF Deathwatch for August 2015 compiled using the objective ETF Deathwatch Criteria . The 20 ETPs added to ETF Deathwatch for August: ALPS Emerging Sector Dividend Dogs ETF (NYSEARCA: EDOG ) Arrow DWA Tactical ETF (NASDAQ: DWAT ) Deutsche X-trackers Muni Infrastructure Revenue Bond ETF (NYSEARCA: RVNU ) Direxion Daily FTSE Developed Markets Bull 1.25x (NYSEARCA: LLDM ) Direxion Daily FTSE Emerging Markets Bull 1.25x (NYSEARCA: LLEM ) Direxion Daily S&P 500 Bull 1.25x (NYSEARCA: LLSP ) Direxion Daily Small Cap Bull 1.25x (NYSEARCA: LLSC ) ETFS Diversified-Factor Developed Europe (NYSEARCA: SBEU ) ETFS Diversified-Factor U.S. Large Cap (NYSEARCA: SBUS ) ETFS Zacks Earnings Large-Cap U.S. (NYSEARCA: ZLRG ) ETFS Zacks Earnings Small-Cap U.S. (NYSEARCA: ZSML ) ETRACS Wells Fargo MLP Ex-Energy ETN (NYSEARCA: FMLP ) iPath US Treasury 2-year Bear ETN (NASDAQ: DTUS ) iShares Global Inflation-Linked Bond (NYSEARCA: GTIP ) iShares MSCI International Developed Momentum Factor (NYSEARCA: IMTM ) iShares MSCI International Developed Quality Factor (NYSEARCA: IQLT ) Master Income ETF (NYSEARCA: HIPS ) ProShares Managed Futures Strategy (NYSEARCA: FUTS ) QuantShares Hedged Dividend Income (NYSEARCA: DIVA ) SPDR Barclays International High Yield Bond (NYSEARCA: IJNK ) The 5 ETPs removed from ETF Deathwatch due to improved health: UBS ETRACS Monthly Pay 2x Leveraged S&P Dividend ETN (NYSEARCA: SDYL ) Guggenheim BulletShares 2022 HY Corp Bond (NYSEARCA: BSJM ) iShares MSCI Emerging Markets Value Index ETF (NASDAQ: EVAL ) iShares MSCI Hong Kong Small-Cap (NYSEARCA: EWHS ) PowerShares KBW Property & Casualty Insurance (PBWP) The 11 ETPs removed from ETF Deathwatch due to delisting: CS X-Links 2x Monthly Merger Arbitrage ETN (NYSEARCA: CSMB ) CS X-Links HOLT Market Neutral Global Equity ETN (NYSEARCA: CSMN ) RBS China Trendpilot ETN (NYSEARCA: TCHI ) RBS Global Big Pharma ETN (NYSEARCA: DRGS ) RBS Oil Trendpilot ETN (NYSEARCA: TWTI ) RBS Rogers Enhanced Agriculture ETN (NYSEARCA: RGRA ) RBS Rogers Enhanced Commodity Index ETN (NYSEARCA: RGRC ) RBS Rogers Enhanced Energy ETN (NYSEARCA: RGRE ) RBS Rogers Enhanced Industrial Metals ETN (NYSEARCA: RGRI ) RBS Rogers Enhanced Precious Metals ETN (NYSEARCA: RGRP ) RBS US Large Cap Alternator ETN (NYSEARCA: ALTL ) Disclosure: No positions in any of the securities mentioned. No positions in any of the companies or ETF sponsors mentioned. No income, revenue, or other compensation (either directly or indirectly) received from, or on behalf of, any of the companies or ETF sponsors mentioned. Share this article with a colleague
A New Exercise In Industry Rotation

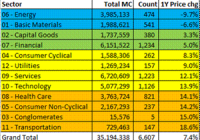
At Abnormal Returns, over the weekend , Tadas Viskanta featured a free article from Credit Suisse called the Credit Suisse Global Investment Returns Yearbook 2015 . It featured articles on whether the returns on industries as a whole mean-revert or have momentum, whether there is a valuation effect on industry returns, “social responsibility” in investing, and the existence of equity discount rate for the market as a whole. There are no surprises in the articles – it is all “dog bites man.” They find that: Industry returns exhibit momentum. There is a valuation component in industry returns. Socially responsible investing doesn’t necessarily produce or miss excess returns. There is an overall equity discount rate, which is levered about 20-25 times, i.e., a 1% increase in the rate lowers valuations by 20-25%. The first two are well known for individual stocks, so it isn’t surprising that it happens at the industry level. The third one has been written about ad nauseam, with many conflicting opinions, so that there is little effect is no big surprise. The last one resembles research I saw in the mid-90s, where the effect of changes in real interest rates has about that impact on stocks. Again, nothing new – which is as it should be. But now some more on industry returns. They found that industry return momentum was significant. Industries that did well one year were likely to do well in the next year. The second finding was that industries with cheap valuations also tended to do well, but it was a smaller effect. So, using one-year price returns as my momentum variable and book-to-market as a valuation variable (both suggested in the article), I divided industries for companies trading in the US into quintiles (also suggested in the article) for momentum and valuation. (Each quintile has roughly 20% of the total market cap.) Here is the result: (click to enlarge) Low valuations are at the right, high at the left. Low momentum at the top, high momentum at the bottom. Ideally, by this method, you would look for industries in the southeast corner. To me, Agriculture, Information Technology, Security, Waste, Some Retail, and Some Transportation look interesting. One in the far southeast that is not so interesting for me is P&C Insurance. Yes, it has done well, and compared to other industries, it is cheap. But industry surplus has grown significantly, leading to more competition, and sagging premium rates. Probably not a great time to make new commitments there. Anyway, the above table should print out nicely on two sheets of letter-sized paper. Not that it would be a substitute for your own due diligence, but perhaps it could start a few ideas going. All for now. Disclosure: None.

Yet Another Reason To Like CORN: A Low Valuation Relative To Gold

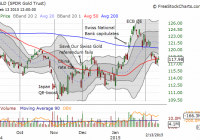
Summary The gold/corn ratio is extremely high relative to recent history. The bounce in CORN since a 40-year high (at least) in the gold/corn ratio seems to confirm a mean reversion is underway. Given corn’s strong underlying demand and a likely trading range for gold, I am betting on higher corn prices to drive most of the on-going mean reversion. I am finally starting to look over the rich agriculture-related resources provided by Teucrium Trading LLC , the financial firm that runs several agricultural ETFs: Teucrium Corn ETF (NYSEARCA: CORN ), Teucrium Soybean ETF (NYSEARCA: SOYB ), Teucrium Sugar ETF (NYSEARCA: CANE ), Teucrium Wheat ETF (NYSEARCA: WEAT ), and Teucrium Agricultural ETF (NYSEARCA: TAGS ) (TAGS invests the other four Teucrium ETFs). As an investor in CORN, I am particularly interested in understanding the supply and demand dynamics of the corn industry. What has my attention right now is an apparent trading signal provided by the amount of gold (NYSEARCA: GLD ) it takes to buy a bushel of corn. It is common to quantify the price of goods using gold as a frame of reference independent of a given paper currency. I have done this with oil and the S&P 500, but I have never thought to do it with agricultural products. In ” Portfolio Rebalancing – a Potentially Golden Opportunity ,” Teucrium references a Bloomberg article from September 24 titled ” Corn Trading Cheapest to Gold Since 1975 Signals Bottom ” to describe the opportunity for exchanging relatively “expensive” gold for relatively “cheap” corn. While I argued last month that it was time to end short-term trades going long gold , I did not think of gold being expensive (more like overbought relative to bets against path to monetary tightening). As expected, SPDR Gold Shares has fallen from the peak defined by QE in the eurozone…Yet, trading just above 5-year lows, it hardly “seems” expensive CORN is also trading near levels last seen five years ago, but it has dropped by 50% and more from recent highs. Since reaching its peak in 2012, CORN has traded ever downward with only two respites The current respite for CORN started, you guessed it, right after the Bloomberg article appeared noting corn’s cheapness relative to gold. Here is a telling chart reproduced by Teucrium. Corn is as cheap as ever relative to gold When I have argued for buying CORN off the lows , I have mainly relied upon a contrary argument that plays on an assumed cyclic nature of the prices for agricultural commodities. I have also noted strong underlying long-term demand dynamics confirmed by Deere’s CEO and soaring demand in China . However, the supply side has been volatile – corn has enjoyed several bumper crops after massive droughts in the U.S. last sent corn prices soaring in 2012. The February, 2015 U.S. Department of Agriculture (USDA) report reproduced by Teucrium along with other worldwide data shows U.S. corn inventory projected at 1.8B bushels, levels last seen in the 2005-2006 crop year. Current inventories are 13.4% of projected total usage. Similar percentages were last seen between the 2008-2009 and 2009-2010 crop years. This five-year high for corn inventory relative to total usage is an important benchmark because it turns out that worldwide demand for gold hit a five-year low at the end of 2014 . These 5-year spans for corn and gold could of course be pure coincidence, but they put current dynamics in good longer-term perspective: current conditions are pushing toward extremes. Assuming that gold is going into a new trading range roughly between the 2014 low and the 2015 high, my bet is on higher corn prices to move the gold/corn ratio closer to a mean reversion. Be careful out there! Disclosure: The author is long CORN, GLD. (More…) The author wrote this article themselves, and it expresses their own opinions. The author is not receiving compensation for it (other than from Seeking Alpha). The author has no business relationship with any company whose stock is mentioned in this article. Are you Bullish or Bearish on ? Bullish Bearish Neutral Results for ( ) Thanks for sharing your thoughts. Submit & View Results Skip to results » Share this article with a colleague