Tag Archives: addpageaction

Long/Short Hedge Fund Factors: Low-Cost Downside Protection?

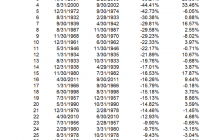
By Wesley R. Gray, Ph.D. The holy grail of financial markets is finding strategies that have misaligned risk and reward characteristics. In the traditional view, investors try to do the following: Identify strategies that have high returns , then… find ways to get the exposure with the lowest risk possible . However, there is another angle on this concept… Identify strategies that have great risk-management benefits , then… find ways to get the exposure at the lowest cost possible . For example, you might buy out of the money puts, which in a crisis will finish in the money and generate insurance-like returns. But puts might be expensive… What if you could identify an asset where the cost of this insurance is de minimus or – better yet – you get paid to own the insurance? That is, if you commit capital, you will, in expectation, generate positive returns over time-and get an insurance benefit. This would be the holy grail! This line of thought is a bit unorthodox, but may lead to creative portfolio solutions. An applied example: The US Treasury Bond. First, let’s frame the question through the typical lens: focus on expected returns first, volatility second. Many consider the US Treasury Bond to have low expected return, but high potential risk. The low expected return is due to low yields, and the high potential risk is associated with the fact that if we were to move down the “banana republic” path, long bonds would arguably get crushed. Everyone seems to know this. Conclusion: Bad investment. Next, let’s frame the question through a different lens: focus on risk-management benefits first, expected returns second. When we look at the US Treasury Bond as a risk-management instrument, we identify some amazing historical benefits that are distinct from its expected return characteristics. The results below highlight the top 30 drawdowns in the S&P 500 Total Return Index from 1927 to 2013. Next to the S&P 500 return is the corresponding total return on the 10-Year (LTR) over the same drawdown period: (click to enlarge) The results are hypothetical results and are NOT an indicator of future results and do NOT represent returns that any investor actually attained. Indexes are unmanaged, do not reflect management or trading fees, and one cannot invest directly in an index. Additional information regarding the construction of these results is available upon request. Leaving aside (for a moment) questions about long-run returns, the US Treasury Bond suddenly looks more like an insurance contract, and less like a traditional investment. Again, with a traditional investment, we would tend to focus first on expected return and standard deviation. Conclusion: We’ve potentially identified an insurance contract that pays us to hold it. Moving from US Treasury Bonds to Hedge Fund Factors The example above is not meant to be a pitch for or against US Treasury Bonds. The analysis is merely meant to highlight how framing the investment decision can potentially lead to different conclusions. In our quest to find additional low-cost-or free-portfolio insurance assets, we started playing with common “factor” returns. As insurance contracts, do these exhibit characteristics similar to what we saw before with respect to Treasury bonds? The results were surprising… We examine 3 common hedge fund “factor” portfolios alongside the S&P 500 Index: SP 500 = SP 500 Total Return Index HML = The average of 2 value portfolios (small and large) minus the average return of two growth portfolios (again, small and large) MOM = The average of 2 high return portfolios (small and large) minus the average return of two low return portfolios (small and large) QMJ = The average of 2 high-quality portfolios (small and large) minus the average return of two low-quality portfolios (small and large) Results are gross of management fees and transaction costs. All returns are total returns and include the reinvestment of distributions (e.g., dividends). Data are from AQR and Ken French . Summary Statistics: Here are the returns (1/1/1963-12/31/2014): (click to enlarge) The results are hypothetical results and are NOT an indicator of future results and do NOT represent returns that any investor actually attained. Indexes are unmanaged, do not reflect management or trading fees, and one cannot invest directly in an index. Additional information regarding the construction of these results is available upon request. Conclusion: You got paid to hold the hedge fund factors over the long-term. Insurance Benefit Analysis: In the context of a traditional asset pricing model, such as the Capital Asset Pricing Model (CAPM), an asset that actually delivers returns when the rest of the world is blowing up (i.e., negative beta during treacherous times), should have a negative expected return because of the diversification benefits. For example, the CAPM says the expected return of an asset equals the risk-free rate plus beta times the expected excess return of the market portfolio: r a = r rf + B a (r m -r rf ) In this equation, if beta is negative, then the asset could earn negative returns and the investor should be happy owning it. For example, let’s say rf=3%, Rm-rf= 4%, and B=-1. The expected return = -1%. Hence, under CAPM, you have to pay for an insurance contract. Yet as the analysis above highlights, all of these L/S factors have positive carry. In a traditional asset pricing framework, these assets should not act like portfolio insurance. But how do these strategies perform as insurance contracts? When we look at the worst 30 drawdowns on the SP 500 since 1963 we see a very interesting pattern – Factors tend to rip higher during crisis. In other words, hedge fund factors look and feel like insurance contracts that pay off during chaos. (click to enlarge) The results are hypothetical results and are NOT an indicator of future results and do NOT represent returns that any investor actually attained. Indexes are unmanaged, do not reflect management or trading fees, and one cannot invest directly in an index. Additional information regarding the construction of these results is available upon request. Conclusion: Hedge fund factors are VERY interesting in a portfolio context. Original Post
Benchmarks May Have Their Uses But Gauging Portfolio Risk Is Not One Of Them

By Nick Kirrage Here on The Value Perspective, we have nothing against market indices in themselves but we do worry about how investors sometimes use them. Say you wanted to measure the relative returns on your investments over a suitably long time period, then please – benchmark away. But if you were planning to use an index as a way of gauging risk on your portfolio, here is why you should think again. People tend to see benchmarks as neutral entities and so, in some way, as an indication of safety – yet they are anything but. The classic example here – as so often – is the tech boom of the late 1990s. As technology stocks rose in value to become an ever greater part of market indices, so any ‘benchmark-aware’ funds had to buy more and more of the sector. As we know, this did not end well. Clearly, buying more tech in early 2000 as a means of reducing your risk relative to a benchmark index was a pretty flawed strategy but this is hardly a one-off example in the world of equities – or indeed in investment as a whole. In the fixed income sector, for example, index-relative global funds end up increasing their exposure to countries with the greatest amount of debt, regardless of the inherent risks. The reason we are revisiting the issue here is because of the recent decision by index provider MSCI not to include ‘A-Shares’ – those traded on China’s mainland stock exchanges of Shanghai and Shenzhen, as distinct from the ‘H-Shares’ traded on the Hong Kong exchange – within its principal global emerging markets benchmark. The last 18 months or so have seen an extraordinary bull run in Chinese equities and, while there have recently been some signs that has started to stall, China – by virtue of those H-Shares – now accounts for roughly 25% of the entire MSCI Global Emerging Markets Index. Had MSCI decided to include China’s A-Shares too, then that weighting would have jumped to around 45%. Presumably it is only a matter of time before MSCI deems all Chinese shares to be part of its emerging markets universe but, to our way of thinking, that is the rather farcical aspect of this debate – after all, regardless of whether MSCI or any other organizations reckons China to be an emerging market, it clearly is one. Where it becomes dangerous – and why we see MSCI’s decision as a near-miss (or perhaps a stay of execution) for benchmark-aware investors – is, the moment A-Shares are included in the index, these people will feel compelled to redirect yet larger quantities of money towards Chinese stocks because they apparently believe it would be a ‘risk’ to be so underweight China relative to their benchmark. But is that not perverse? It is not as if some huge new risk will have been revealed the day China’s weighting moves up from, say, 25% to 45%. Either it was always a risk to hold 25% in China or it was never one. The reality will not have changed, only some of the rules – but those rules can become hugely distorting. After all, if A-Shares had received the nod from MSCI and China now made up almost half the index, benchmark-aware investors would have had to scale back their exposures to other important emerging markets – for example, to 11% in Korea, 5.5% in Brazil and just 5% in India. This may not be quite as stark as our earlier tech boom example but it could have similarly unwanted consequences. Mind you, it could also throw up some similarly inviting possibilities for investors who prefer, as we do here on The Value Perspective, to think about risk in absolute as opposed to relative terms and for whom, in many ways, benchmark indices represent an opportunity more than they do a threat.

VTI: Who Cares About The Middle Class?

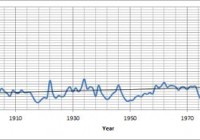
Summary New legislation that may curtail unpaid overtime has been introduced. The P/E ratio of the market is at moderately high levels but the E (earnings) relative to GDP is extremely high. A shift to higher income for labor would be a negative short term catalyst but may be necessary for long term economic health. I’m preparing for the shift by buying less broad/total market funds and more equity REITs. While the turmoil in Greece has been capturing the headlines, there are other issues that may hit much closer to home. I’ve been a fan of indexing the market and riding out the bumps through dollar cost averaging. I believe American investors can be served well by using a diversified index like the Vanguard Total Stock Market ETF (NYSEARCA: VTI ). Even as an analyst, I combine VTI with equity REIT ETFs as the major source of value in my portfolio. I believe in using the index as the main holding and attempting to build around it rather than attempting to individually pick every stock. While VTI is delivering an excellent expense ratio (.05) and excellent diversification (3827 holdings), it is still subject to market risk. I am concerned that we may be nearing a market top for the broad equity market and I am shifting my portfolio to a heavier concentration of equity REITs. Because I believe shorting the market is the game of fools, I would never recommend it. However, I do think the risk/return proposition favors equity REITs. The Middle Class There is a common refrain about the disappearing middle class. I must admit that I do believe over the next decade we may see a further increase in the gap between the “Haves” and the “Have Nots”. In my opinion, the market is far less attractive without consumers to buy the crap on the shelves. Background It helps to remember that the market can still be viewed by running numbers on the S&P 500 which makes up a very substantial portion of VTI. The following chart, built with data from multpl.com, shows the P/E ratios for the S&P 500 over a very long time frame. (click to enlarge) You might notice that we are currently right around the trend, but that is a very serious problem when we consider that earnings are exceptionally high as seen in the chart below: (click to enlarge) Corporate profits after taxes are hitting staggering values by historical measures. I believe a major factor in the high corporate profits is the introduction of more automation and a lack of intense competition in some sectors. One sign for weaker competition is buybacks. When companies are spending their cash on repurchasing shares there is an improvement in the P/E ratio and there is a fundamental increase in the shareholders ownership of the assets, but there is no increase in productivity capacity. A lack of new capacity leads to weaker competition which protects profit margins. If you need to see what high capacity and intense competition looks like, simply research companies in the mining sector. Earnings, ore prices, and share prices have fallen dramatically due to the intense competition. If corporate profits after tax were to revert to a more historically normal level as a percentage of GDP without enormous growth in GDP, it would lead to much lower earnings. Those lower earnings in turn would lead to lower share prices unless the P/E multiples increased significantly. The Headwind for Earnings The White House recently released a fact sheet on some proposed new legislation that would significantly expand the number of workers eligible for overtime pay. Nearly five million workers would be covered and this could set up quite a bit of political sparring. If nothing else changed and the companies simply paid the overtime that is currently avoided through “salaried” compensation, the simple result would be increases in labor expenses and compressed profit margins. At the same time, I would expect increased levels of sales as more money would go to middle class and lower class workers with a high propensity to consume . In short, the money would go into their pockets and then into the cash register at another establishment. Companies Won’t Agree I expect to see some fairly substantial lobbying efforts spend to fight or minimize this bill because the cost of purchasing congressmen and senators is cheaper than the cost of paying overtime to low-wage salaried employees. Was that too blunt? I’d rather get the point across clearly. The legislation is designed to raise the level of salary required to keep an employee exempt. The reason it is important for the long term health of the economy is that the current level is at less than $24,000 per year. By labeling employees as exempt, companies are able to work the employees for overtime that can drive their effective wage rate below minimum wage laws while claiming that the employees are “managers”. To the extent that this encourages companies to simply hire more employees for regular schedules, the change could be positive by improving employment rates and revitalizing a struggling middle class. However, it wouldn’t happen without pain. While the sales would be expected to increase, the weaker margins would compress earnings and I would expect share prices to fall. For VTI, that could mean share prices dropping as low as $90 in a bearish scenario (about a 15% pull back). Long Term I believe the long term implications would be very positive as it would improve employment prospects for many struggling families so a significant pull back would become a great buying opportunity. Without growth in the middle class, I think the growth in EPS from repurchasing shares may become unsustainable because earnings still depend on sales and sales still require consumers that can afford the products. In the short term, growth by repurchasing sales is fine. Over the long term, it fails to provide new productive (physical) assets that generate the wealth that we consume as humans. Seeing an end to unpaid overtime through the guise of “salaried” work would be a short term negative catalyst for stock prices, but it may be necessary for a healthy economy. I’m preparing by shifting more of my purchases into the REIT sector where I expect strong income to translate into higher average rents. I’m reducing my purchases of the broad U.S. market, to the acquisitions made by my dollar cost averaging in an automatic retirement account. How will you prepare? Disclosure: I am/we are long VTI. (More…) I wrote this article myself, and it expresses my own opinions. I am not receiving compensation for it (other than from Seeking Alpha). I have no business relationship with any company whose stock is mentioned in this article. Additional disclosure: Information in this article represents the opinion of the analyst. All statements are represented as opinions, rather than facts, and should not be construed as advice to buy or sell a security. Ratings of “outperform” and “underperform” reflect the analyst’s estimation of a divergence between the market value for a security and the price that would be appropriate given the potential for risks and returns relative to other securities. The analyst does not know your particular objectives for returns or constraints upon investing. All investors are encouraged to do their own research before making any investment decision. Information is regularly obtained from Yahoo Finance, Google Finance, and SEC Database. If Yahoo, Google, or the SEC database contained faulty or old information it could be incorporated into my analysis.