Tag Archives: addpageaction

Dual Momentum July Update

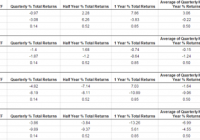
Scott’s Investments provides a free ” Dual ETF Momentum ” spreadsheet, which was originally created in February 2013. The strategy was inspired by a paper written by Gary Antonacci and available on Optimal Momentum . Antonacci’s book, ” Dual Momentum Investing: An Innovative Strategy for Higher Returns with Lower Risk “, also details Dual Momentum as a total portfolio strategy. My Dual ETF Momentum spreadsheet is available here , and the objective is to track four pairs of ETFs and provide an “Invested” signal for the ETF in each pair with the highest relative momentum. Invested signals also require positive absolute momentum, hence the term “Dual Momentum”. Relative momentum is gauged by the 12-month total returns of each ETF. The 12-month total returns of each ETF is also compared to a short-term Treasury ETF (a “cash” filter) in the form of the iShares Barclays 1-3 Treasury Bond ETF (NYSEARCA: SHY ). In order to have an “Invested” signal, the ETF with the highest relative strength must also have 12-month total returns greater than the 12-month total returns of SHY. This is the absolute momentum filter, which is detailed in depth by Antonacci, and has historically helped increase risk-adjusted returns. An “average” return signal for each ETF is also available on the spreadsheet. The concept is the same as the 12-month relative momentum. However, the “average” return signal uses the average of the past 3-, 6-, and 12- (“3/6/12”) month total returns for each ETF. The “invested” signal is based on the ETF with the highest relative momentum for the past 3, 6, and 12 months. The ETF with the highest average relative strength must also have an average 3/6/12 total returns greater than the 3/6/12 total returns of the cash ETF. Portfolio123 was used to test a similar strategy using the same portfolios and combined momentum score (“3/6/12”). The test results were posted in the 2013 Year in Review and the January 2015 Update. Below are the four portfolios along with current signals: (click to enlarge) As an added bonus, the spreadsheet also has four additional sheets using a dual momentum strategy with broker-specific commission-free ETFs for TD Ameritrade, Charles Schwab, Fidelity, and Vanguard. It is important to note that each broker may have additional trade restrictions, and the terms of their commission-free ETFs could change in the future. Disclosures: None Share this article with a colleague
Volatility Decays Without The Roll

“Roll Yield” is a frequently spoken about but lesser understood phenomenom. Volatility futures decay without the roll. Continue to short volatility for excellent long-run gains. Roll decay is a term that is commonly thrown around when discussing futures. It is an easily observable phenomenon in commodities markets that results from a positively sloping forward curve. When an electronically-traded-product “rolls” contracts along such a curve, it sells near-term futures and uses the proceeds to buy further-out futures. In rolling, the net value of the fund has not changed. Maybe 12 near-term contracts valued at $10 each were sold for 10 further-out $12 contracts. The gross value is $120 immediately before the transaction and $120 immediately after the transaction. There is no decay in asset value. The decay happens afterwards…sometimes. In the example above, both contracts were priced above the spot rate, and the further-out contract was priced above the near-term. If the underlying asset is a random walk, then on average (long-term average), the moving average of the spot will be equal to the current spot. In other words, the expected return on carry is 0. So both futures will need to drift down, and the further-out future will need to drift down more. In the real world, most assets are not a random walk. They tend to drift themselves. If they are positively correlated with the market, they tend to drift upwards; and vice versa. In commodities and equities markets, this drift is fairly deterministic in the long-run and becomes implicit in the term structure. Therefore the “roll” decay is, in fact, a result of rolling less-overpriced contracts into more-overpriced contracts. The VIX is very different. It’s not a random walk. It’s a random spring. It makes a lot of noise but its long-run moving average is very predictable. When the VIX spot is $12 and the first month future is $14, the empirically derived mathematical expectation of the first future isn’t to converge to $12. Instead it is to converge to something like $13, as the spot springs from $12 back toward its center and hits $13 along the way. Likewise when the VIX spot is $30 and the first month future is $26, a long position on the first month future still decays (on average) because the spot drops down to something like $25 on average. Please see this article for elaboration: The take away is that the slope of the volatility forward curve is of little to no consequence. ETN’s like TVIX, VXX, and VXZ will continue to decay so long as they are tied to VIX futures that are themselves individually overpriced (in comparison to their mathematical/statistical expectations.) For something like the VXX, the “roll” decay occurs because it is in constant possession of two futures contracts (M1 and M2), that are in an almost perpetual state of being over-priced. The allocations are irrelevant. If VXX stopped rolling contracts, any static mix of M1 and M2 would show similar performance on average. Volatility futures decay standing still. So unless you have a crystal ball or an uncanny ability to predict the future, betting against volatility futures continues to be highly advisable. There will be plenty of noise short-term, but long-term bets will reap in the green. And plea se see the following article if you would like to drown-out some of the noise: Disclosure: I/we have no positions in any stocks mentioned, and no plans to initiate any positions within the next 72 hours. (More…) I wrote this article myself, and it expresses my own opinions. I am not receiving compensation for it (other than from Seeking Alpha). I have no business relationship with any company whose stock is mentioned in this article. Additional disclosure: I am short volatility futures.

Lipper Closed-End Fund Summary: June 2015

For the second consecutive month both equity and fixed income CEFs suffered negative NAV-based returns (-2.84% and -0.74% on average, respectively, for June) and market-based returns (-4.31% and -2.83%). Year to date, however, both groups just remained in positive territory, returning 0.41% and 0.91% NAV-based returns. While the Russell 2000 and the NASDAQ Composite managed to break into record territory in mid-June, advances to new highs were generally just at the margin. However, at June month-end concerns about the Greek debt drama, looming U.S. interest rate increases, Puerto Rico’s inability to service its public debt, and China’s recent market gyrations weighed heavily on investors. A positive finish for equities on the last trading day of June wasn’t enough to offset the Greek debt-inspired meltdown from the prior day, and many of the major indices witnessed their first quarterly loss in ten. Volatility was on the rise in June. At the beginning of the month rate-hike worries plagued many investors after an upbeat jobs report raised the possibility of an interest rate hike this fall. The Labor Department reported that the U.S. economy had added a better-than-expected 280,000 jobs for May, beating analysts’ expectations of 210,000. Despite a rise in the unemployment rate to 5.5% (as once-discouraged job seekers reentered the labor market), many pundits felt the Federal Reserve would be more likely to raise interest rates sooner rather than later. However, European equities showed signs of weakness, and investor handwringing began in earnest as investors contemplated the looming deadline for Greece to make its first debt payment to the IMF at the end of June. And while early in the month the Shanghai Composite rose above the 5,000 mark to its highest level since January 2008, on Friday, June 19, the Shanghai Composite posted its worst week in more than seven years as investors bailed on some recently strong-performing Chinese start-ups. Worries of high valuations and record levels of margin debt sparked the exodus. Investors’ trepidations were not easily dispelled, and by mid-month more talk about a Greek exit (“Grexit”) from the Eurozone and anxiety before the Federal Open Market Committee’s June meeting led to further selloffs in the equity markets. A combination of an impasse in the Greek debt talks along with a purported quadruple-witching day sent the Dow to a triple-digit decline on Monday, June 29, with Treasuries rallying on the news as investors looked toward safe-haven plays. For June the Dow, the S&P 500, and the NASDAQ were in the red, losing 2.17%, 2.10, and 1.64%, respectively, while a strong small-caps rally helped send the Russell 2000 up 0.59%. Nonetheless, interest concerns trumped the Greek drama, and for the month Treasury yields rose at all maturities, except the three-month. The ten-year yield rose 23 bps to 2.35% by month-end. For the third consecutive month none of the municipal bond CEFs classifications (-0.36%) witnessed plus-side returns for June. However, the municipal bond CEFs macro-classification did mitigate losses better than its domestic taxable bond CEFs (-1.12%) and world bond CEFs (-1.45%) brethren. Despite the Greek debt drama, world equity CEFs (-2.04%) mitigated losses better than their mixed-asset CEFs (-2.11%) and domestic equity CEFs (-3.41%) brethren. And Growth CEFs (+0.68%) posted the only positive return in the equity universe for the month, while Energy MLP CEFs (-8.85%) was at the bottom. For June the median discount of all CEFs widened 135 bps to 10.52%-worse than the 12-month moving average discount (8.92%). Equity CEFs’ median discount widened 90 bps to 10.74%, while fixed income CEFs’ median discount widened 162 bps to 10.44% (their largest month-end discount since October 2008). For the month only 5% of all CEFs traded at a premium to their NAV, with 7% of equity funds and 4% of fixed income funds trading in premium territory.