Tag Archives: addpageaction

High Yield ETF Posts A New 52-Week Low For The First Time In 2015

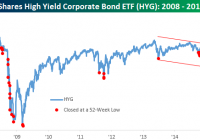
Driven largely by renewed weakness in the energy sector and that sector’s big weighting in high yield corporates, high-yield spreads are once again widening out over the last few weeks. From a level of 465 basis points above treasuries a month ago, high yield spreads, as measured by the Merrill Lynch High Yield Master Index, have shot up to 549 bps, which is the highest level of the year. In just the last week alone, spreads have widened out by 54 bps, which is the largest 5-day move since late December. As spreads on high-yield debt have widened, prices have dropped and that has made it a rough go for holders of the high yield corporate bond ETF (NYSEARCA: HYG ). Year to date, the ETF is down over 3% not including dividends. That may not sound like much for an equity investment, but for fixed income investors, any loss of capital is an unwelcome trend. Following Monday’s decline of 0.45%, HYG closed at a new 52-week low for the first time in 2015. The chart below shows the price action in HYG going back to early 2008, and the red dots represent each time the ETF closed at a 52-week low. Yesterday’s new low was the 39th time that the ETF has traded at a new one-year low. Prior to Monday, the last time HYG traded at a 52-week low was in December when there were seven occurrences. While a bounce for HYG is certainly possible given the degree to which the ETF is now oversold, the longer term pattern doesn’t look particularly promising as it has been characterized by lower highs and lower lows ever since its bull market high in early 2013. Share this article with a colleague
An Alternative Way To View Diversification

We’re living in a post 2008-2009 financial crisis world. Investors and advisors alike know that having your eggs all in one basket could land you in some hot water (especially if it’s the arguably broken 60/40 portfolio). The reason being, one single person or group isn’t able to call what’s going to be the “best” asset class (by performance only) in any given year. Enter the ever so popular diversification quilt , which essentially ranks each asset class top to bottom over the past 15 years. The issue, of course, is that although they include 10 asset classes, they really don’t include alternative investments, specifically Managed Futures. The latest to release a chart like this is Business Insider. As you might remember, we took the liberty of changing around the “quilts” published by Bloomberg back in September by adding Managed Futures to the mix. The second issue with the quilt table is that these “quilts” are all on the same axis level. For example, if an investment was the worst performer of the year and still up 2 or 3 percent, it would look the same as an investment that came in last at a -10% on a different year. Which got us thinking how different would the table look if we spread out the investments so that the performance range would be visible? This is what we got. P.S – Looking at each asset class on its own fluctuates year to year, is just one way to look at volatility. So, so we connected the dots of the largest performance range (Emerging Markets), Managed Futures, and the smallest performance range (Cash). (click to enlarge) (Past performance is not necessarily indicative of future results) Source: Large Cap = S&P 500 Small Cap = Russell 2000 Intl Stocks = MSCI EAFE Emerging Markets = MSCI Emerging Markets REIT = FTSE NAREIT All Equity Index HG Bond = Barclay’s U.S. Aggregate Bond Index HY Bond =BoAML US High Yield Master II Cash= 3 Month T Bill Rate AA = Asset Allocation Portfolio (15% Large Cap, 15% Intl Stocks, 10% Small Cap, 10% Emerging Markets, 10% REIT, 40% HG Bond Share this article with a colleague

3 Keys To Navigating A Low Return Environment (Video)

2015 has me wondering – is this a precursor to what the future could look like? That is, are the low returns across so many asset classes likely to be a sign of what’s to come? In a BNN interview from this morning, I laid out the case for why returns are likely to be lower, and how we can be proactive about it. Here’s the gist of my thinking: We know that the Global Financial Asset Portfolio is roughly a 45/55 stock/bond portfolio today. We also know that bonds likely won’t generate high returns in the future, given the low interest rate environment (current rates are a very reliable indicator of future returns). We also know that stocks are overvalued by many metrics, and are very likely more risky than they were in 2009/10/11. So, let’s be generous on the stock side and assume 10% returns and 3% from bonds (also generous given the aggregate yield of about 2.5%. That gets us to about 6.5%. But what’s scary about the 6.5% is that it will be driven mainly by the inherently more risky piece of the portfolio – the stocks. So, returns are likely to be lower and/or riskier than we’re used to. Given this high-probability outcome, I think the markets have forced us to get creative to some degree. No one in their right mind is going to hold a 30-year T-bond to maturity, given the near-0% probability of generating a high real return. Likewise, given the risks in stocks, I think you have to be somewhat selective about where you diversify. So, what can we do? I offered three keys: Control what you can control. The only way to guarantee higher returns is by reducing taxes and fees. My general rule of thumb is to try to always maintain a 366-day time frame and never pay more than 0.5% per year in fees. Diversify, but don’t diworsify. You can be diversified without owning everything in the whole world. This market environment is forcing us to be somewhat selective about where we diversify our assets. I focus on a cyclical approach . Learn to be dynamic without being tax- and fee-inefficient. A static 50/50 or 60/40 isn’t likely to generate the types of returns investors have become accustomed to. You can be strategic in your portfolio without being hyperactive. This could mean a more thoughtful approach to rebalancing, or it could mean veering more into strategic asset allocation. “Active” is only a four-letter word in this business if it’s tax- and fee-inefficient. After all, as I’ve discussed repeatedly , we all have to be active to some degree, but there are smart ways to do this and self-destructive ways to do this… You can watch the full interview here: Share this article with a colleague