Union Pacific: How To Trade Around A Core Position
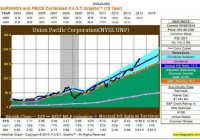
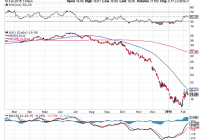
Summary After researching and developing a clear investment thesis, I designated Union Pacific a “core” equity position. Disciplined trading around core positions permits an investor to harvest gains, then buy back shares during routine over/undervaluation cycles. Here’s a step-by-step “How To Do It” featuring Union Pacific stock; including concepts, specific process, and results. Union Pacific Corp. (NYSE: UNP ) is a core position in my portfolio. Here’s my definition of a core position : An investment security identified as a foundation holding; a position the portfolio owner believes meets fully his/her investment philosophy and objectives. The owner expects the investment thesis to be strong, long-term, and durable. Notably, even if a core position, I own no “buy and hold forever” stocks. I scale in and scale out of equity positions; accumulating shares when prices appear discounted, and distributing shares when prices are deemed expensive. Typically, a core position “base” remains in my portfolio for years. The accumulation/distribution process usually takes months. As an example, we will use Union Pacific common stock. UP is America’s largest Class I railroad, effectively covering the western two-thirds of the country. In addition, the company has six gateway interchanges with Mexico, and a busy west coast marine/rail intermodal business. Union Pacific Investment Thesis About 2 years ago, Seeking Alpha editors published my initial article about Union Pacific . I outlined an investment thesis, then reinforced it in a subsequent article . That thesis is outlined below: The railroad business is an oligopoly, or a “large moat” enterprise. Carriers enjoy good returns on capital, generate profits in cash, and have strong franchises…and thus enjoy a level of pricing freedom. Based upon multiple operational and financial measures, I believe Union Pacific is the best-of-breed U.S.-based railroad. Its balance sheet is the strongest in the industry. The company operates primarily throughout the western two-thirds of the United States, offering superior span, scale, and future growth. Multiple west-coast and Mexican interchanges provide unique international opportunities. Union Pacific has experienced strong revenue growth via transportation of automobiles, industrial products, and chemicals. Historically, such freight lines do well in an expanding economy. UP expects these segments to continue to drive strong volumes and revenues. Coal volumes remain a concern for all major rail carriers. After a difficult 2013, coal shipments stabilized in 2014. In addition, UP has a heavy tilt to “oil” versus “coal.” While the long-term trend for U.S. coal consumption is at best uncertain, the trend for crude oil and related drilling materials (pipe, frac sand, etc.) is expected to be positive. UNP management is shareholder-friendly. The 5-year dividend growth rate is 27%. Since the end of 2006, share repurchase plans have reduced the number of diluted shares outstanding by more than 18%. The Initial Accumulation Phase Having developed an investment thesis, backed by fundamental due diligence, it was time to buy the stock. Here is an outline of my original UNP purchases. I bought shares in 3 transactions, beginning in early 2013. For illustrative purposes, I’ve denoted share quantities proportionally to round a sum total of “100” shares. Purchase prices are actual: Bought 40 shares @ $150 Bought 40 shares @ $153 Bought 20 shares @ $163 These 3 purchase events were spaced over 6 months. While I prefer to buy at lower and lower prices (yes, folks, I hope a stock goes DOWN after I begin to buy it), this time corporate performance and prices didn’t cooperate. I bought shares, waited, bought some more at just a little higher price, then waited several months before combining 2 related decisions: I thought it time to fill out the “100” share position I believed the stock was still trading significantly below fair value Note the last purchase was for a lesser amount of shares than the first two purchases. If the stock price had gone DOWN, instead of up, I would have bought even more shares. A Time to Wait Patiently After accumulating a “full” UNP position, I waited. Waiting isn’t idle time. All the while I monitored the investment and “did the homework.” This included reading and reviewing routine news releases, earnings reports, earnings conference call presentations/transcripts, investor presentations, and the SEC filings. Pleasantly, Union Pacific shares trended upward. By June 2014, prices topped $200 a share. I was faced with a high-grade problem: I deemed the shares overvalued. The Distribution Phase In June 2014, SA published another article I wrote about Union Pacific entitled, ” Premier Companies, But Overpriced Stocks – Part 1. ” At the time, I viewed UNP common shares to be trading too rich. Among the evidence, I offered the following F.A.S.T. graph: (click to enlarge) Notice how the black line (price) had become far upfield from operating earnings (the green shaded area). Shares were trading above expected full-year 2014 EPS and the year wasn’t half over yet. Note: In mid-2014, Union Pacific’s stock split 2-for-1. Post-split, I owned “200” shares each worth about ~$100. So, as aligned with my article, I began lightening up shares in June. Selling “40” post-split shares represented 20% of my original “100” share holding. The stock had appreciated ~38% from my first purchase. General Rule #1: When a stock is up more than 25%, sell about 25% of the original holding. “But Ray,” you may ask, “The stock was up more than 25% and you sold less than 25%! You didn’t follow your own rule!” Yes, you are correct. Indeed, I didn’t think the shares were overvalued until cracking $100; and when they breached that mark, the stock was running. Postponing the sale was buttressed additional rationale: the 1Q 2014 earnings report/forward guidance/ongoing fundamentals were outstanding, the technical charts were strong, and I tossed in a dash of intuition. Therein lies the beauty of being an Individual Investor . I don’t have to answer to anyone except myself. Yes, I have investment rules. But I can bend the rules. As an Individual Investor , I have the right to be delightfully inconsistent. After I sold shares at $104, I felt reasonably confident the price would hit a wall. I was wrong. The shares kept running up. So here’s another “rule” for consideration: General Rule #2: Never accumulate or distribute shares all at once, no matter how certain you are. Scale in and scale out in increments. To do otherwise is arrogant. While I bent my first rule, following the second one resulted in a lot of additional gains. Between June and the end of the year, I sold down as the stock went up: Sold 20 shares @ $121, and finally sold 40 shares @ 119. By the end of 2014, I had offloaded half my total UNP shares. Since Union Pacific was a core position, my plans were to sell not more than 50% of the original holding. I had a nice profit from the shares sold. Now it was time to wait again. Historically, the stock should revert to the mean and “come in” again; at such time, I would attempt to regain my old “100” share position. Why should I expect this? The stock was trading above fair value. I Hear the Train Coming! In late 2014 and early 2015, a confluence of news and events started to bang down railroad stocks. The price of oil plummeted, causing a perceived huge loss of crude-by-rail volumes, as well as oilfield materials. Coal shipments got soft. Striking longshoremen shut down Long Beach and LA container ports. Rail safety regulations were raised. Some investors fretted about the wider Panama Canal. Share prices began to fall. I agree some of the foregoing justified part of the decline. However, based upon historical P/E multiples, the shares were overpriced at $104. The stock ran up over $120. Did the business get much better to deserve that uplift? No. When shares went from $104 to $124.50 (the high), the underlying corporate fundamentals didn’t get better. The stock price and earnings just separated; and Union Pacific share price and earnings have a long history of following each other. General Rule #3: For the vast majority of stocks, price follows earnings and/or cash flow. Corollary: Sometimes stocks stay overvalued for a while. That’s ok. Don’t get greedy. Let’s look at an updated F.A.S.T. graph. It’s instructive: (click to enlarge) Despite all the media hoopla and brokerage house hand-wringing, we see that the price decline from $124 to 106 (a 15% correction) simply re-united Union Pacific stock price and earnings. UP 1Q 2015 Earnings: A Re-Calibration Opportunity During the 1Q 2015 earnings report, we found Union Pacific management wasn’t in a state of panic. Some facts: Operating earnings grew to $1.30 a share from $1.19 a year earlier A 64.8% operating ratio bested the full-year 2014 average Year-over-year net margins improved Operating cash flows were up YoY freight revenues were down 1%; volumes were down 2% During management’s earnings discussion and conference call, we learned that coal volumes are likely to remain soft throughout 2015. Energy transportation volumes are uncertain, but there’s no expectation of permanent impairment. Agriculture and automobile shipments are expected to be good. Intermodal transportation is forecast to recover in 2Q as west coast ports get back to business. Shares outstanding are down again on strong repurchase activity, and the first-quarter dividend was bumped up 10%. And while BNSF is rumbling to be get more competitive on some routes, Union Pacific expects 2015 “core pricing” to improve by 3.5%. Key Learning: The fundamental investment thesis outlined at the beginning of this article, set over 2 years ago…has not changed. Accumulating Shares To Rebuild The Position By March, the train arrived at the station. Share prices were “coming in,” falling below $110. Since March, here’s the action: Bought 20 shares @ $109 (a bit early, but refer to Rule #2!) Bought 20 shares @ $106 Bought 20 shares @ $104 Now, here’s one more general rule: General Rule: Don’t repurchase shares for more than you sold them. Never chase. Remember, I had distributed “60” shares at $119 and $121? Well, now I’ve bought these back at prices between $104 and $109. However, I “prematurely” sold the first “40” share block at $104. Therefore, I will not buy these last “40” shares back unless I can get them for AT LEAST a 7% discount. Otherwise, my net/net after tax could be a washout. I have placed a limit order and sold short puts, whereby I will not purchase additional long shares unless $97 or less. Conclusions Trading around a core position requires discipline and patience. Have a researched and complete investment thesis before buying any stock. Accumulate shares in increments. Determine at what price you believe this stock is overvalued. Distribute shares above your price. Sell down shares in increments. Never completely sell core positions, unless the ownership thesis has turned negative. When shares revert to fair value or less, you may begin to repurchase. Repurchase shares in increments. Only repurchase distributed shares at lower prices than those sold. Don’t chase. Union Pacific: Price, Volume and SMAs (2013-to-date) (click to enlarge) Courtesy of bigcharts.marketwatch.com Please do your own careful due diligence before making any investment. This article is not a recommendation to buy or sell any stock. Good luck with all your 2015 investments. Disclosure: The author is long UNP. (More…) The author wrote this article themselves, and it expresses their own opinions. The author is not receiving compensation for it (other than from Seeking Alpha). The author has no business relationship with any company whose stock is mentioned in this article.