S&P High Yield Dividend Aristocrats ETF Performance Analysis
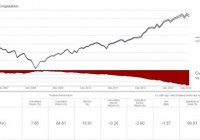
The S&P High Yield Dividend Aristocrats ETF is the SPDR S&P Dividend ETF (NYSEARCA: SDY ). We will take a look at the performance of SDY to see how it is doing versus its index, the S&P High Yield Dividend Aristocrats Index. See “How to Make an Investment Portfolio: 6 Steps to Better Investing” for a full understanding of how to make the best dividend-paying index portfolio. SDY tracks a dividend yield-weighted index of 97 dividend-paying companies from the S&P 1500 Composite Index that have increased dividends for at least 20 consecutive years. Here is a chart of the performance of SDY versus the S&P High Yield Dividend Aristocrats Index: (See our analysis below.) (click to enlarge) Source: Zephyr StyleADVISORTM Our analysis of this chart: Since inception, SDY has tracked its index very closely. SDY is tracking its index closer than the expense ratio. The expense ratio for SDY is 0.35% and SDY has only lagged its index by 0.26%. Here is a chart of SDY versus the S&P 500 Index: (click to enlarge) Source: Zephyr StyleADVISORTM Our analysis of this chart: During the beginning of the downtrend that started in 2007, SDY underperformed the S&P 500 Index. This seems counter intuitive, as you would think that companies with a 20-year history of dividend increases would be popular. Looking closely, you will find that several of those companies were banks, which did very poorly during the downturn. SDY is rebalanced quarterly and many of these struggling companies were replaced because they did not meet the 20-year screen any longer. In the end, SDY actually fell a little less than the S&P 500 Index. Since the bottom of the market in March of 2009, SDY has kept pace with the S&P 500 Index. This is a narrow fund with only 97 companies. You may have to be patient with this fund in the future if it underperforms. Keep in mind that it is rebalanced, which can help bring SDY back on track. Share this article with a colleague
