Scalper1 News
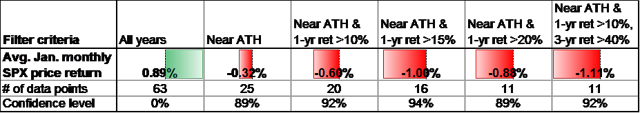
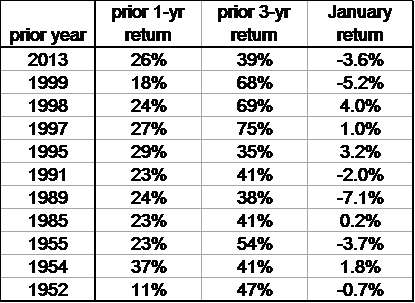 The S&P 500 index was up 11% in 2014 and up 64% over the past 3 calendar years before dividends. When the stock market is at or near all-time highs at the end of December the following January has on average posted a negative return. This reversal effect, likely due to delayed selling because of capital gains taxes, is stronger when the recent 1-year and 3-year returns are high. The past three calendar years have been quite good for the US stock market. Using S&P 500 index data from Yahoo Finance we have only seen better returns for three consecutive calendar years in the late 1990s and the mid-1950s. The S&P 500 data we use begins with full calendar year data in 1951, so we have 63 calendar years of data in our sample through 2013. What can we expect going forward for the stock market or more specifically the S&P 500 index ETFs, (NYSEARCA: SPY ), (NYSEARCA: IVV ), and (NYSEARCA: VOO ), after such a great run? It’s hard to come to any significant conclusions with just five data points, so we want to expand the sample size a bit before analyzing the data. One distinction we can make for this year versus the average year is that we are at all-time highs for the S&P 500. On a monthly closing basis the all-time high was in November with the S&P 500 closing at 2067. December’s close of 2058 is basically right there. There are 25 calendar years in our data set where the December closing level is within 2% of the all-time high. That is enough data to start to draw some conclusions. If we filter this some more by removing years where the last calendar year price change (return before dividends) was less than +10% we have 20 data points. Filtering with a +15% price change gives us 16 data points. We use price change rather than total return because returns from dividends don’t affect decisions about whether to take capital gains or not. The results of various filters are shown in the table below. In the filter criteria, “Near ATH” means December close is within 2% of the monthly closing all-time high, “1-yr ret” means the price change over the prior calendar year, and “3-yr ret” means the price change over the prior three calendar years. (click to enlarge) The confidence level in the last row of the table is a statistical measure that tells us the likelihood that the average January return of each subset of years is actually lower than the typical January return and the difference is not just due to statistical noise. In other words looking at the “Near ATH” column in the table we see there is an 89% chance that Januaries that begin near the all-time high for the S&P 500 can be expected to be worse than the typical January. While this doesn’t pass common statistical tests than require 95% or 99% confidence, it is still worth keeping in mind as investors consider what to do with their portfolios in the New Year. The filter that most closely matches the current environment is the far right column. There have been 11 years since 1951 that end near all-time highs, had greater than +10% price change and finish a three-year period with price change greater than 40%. The subsequent Januaries average price return was negative at -1.11%. The standard error on this sample mean estimate is 1.45%, so while the -1.11% seems significantly different from +0.89% (the average of all years), the difference between the two numbers isn’t that much more than the standard error. The eleven years that match this criteria are shown in the following table. Six out of 11 years are down in January and five are up. The best January in the table follows 1998 with a +4.0% return and the worst follows 1989 with a -7.1% return. Clearly the one year variation is fairly wide, so we can’t expect this January to have exactly a -1.11% decline. How should an investor use this information? Here are a few possibilities. If she wants to add to her equity position, waiting until February might be wise. If rebalancing is in order for a portfolio, and that involves reducing equity exposure, do it sooner rather than later. If it involves adding to equity exposure, wait a month. If there are capital gains in a taxable account and there is any need for the cash this year, sell sooner in January rather than later. If this potential January reversal takes place before an investor can act, it’s probably not a good idea to sell equities out of fear of further declines. For the months of February and March following the eleven Januaries in the table above the combined average returns were +4.1%. We can’t expect this January reversal phenomenon to persist into February and March. We attribute this reversal of returns in January to the impact of capital gains taxes, and delayed selling over the recent past to delay the capital gains tax until April 2016. There could always be some other reason for further selling, or for buying that overwhelms the tax impact to give us a positive return in January. There are a lot of possibilities for what happens to markets in January and in all of 2015. This is just another piece of data to consider that we view as important in the next month. Now that you’ve read this, are you Bullish or Bearish on ? Bullish Bearish Sentiment on ( ) Thanks for sharing your thoughts. Why are you ? Submit & View Results Skip to results » Share this article with a colleague Scalper1 News
Scalper1 News