Scalper1 News
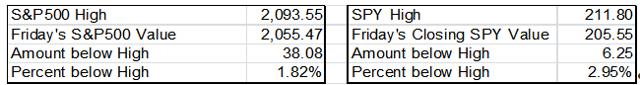
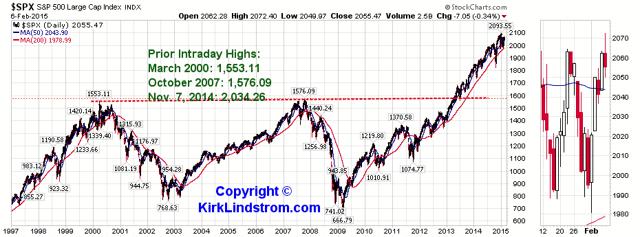
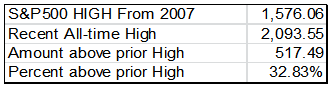
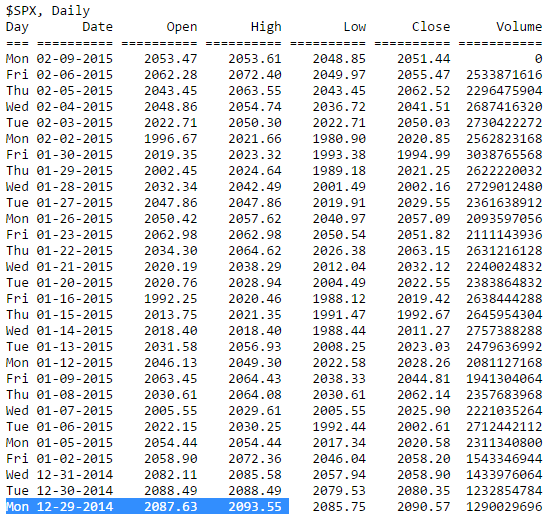
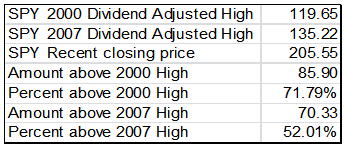
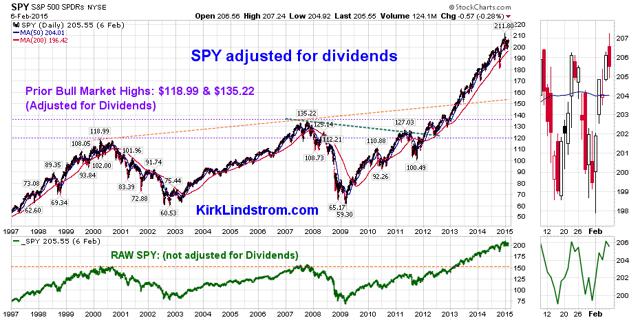
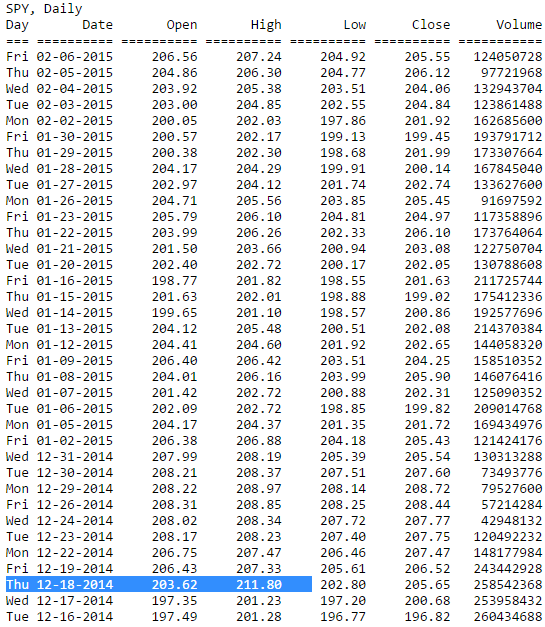
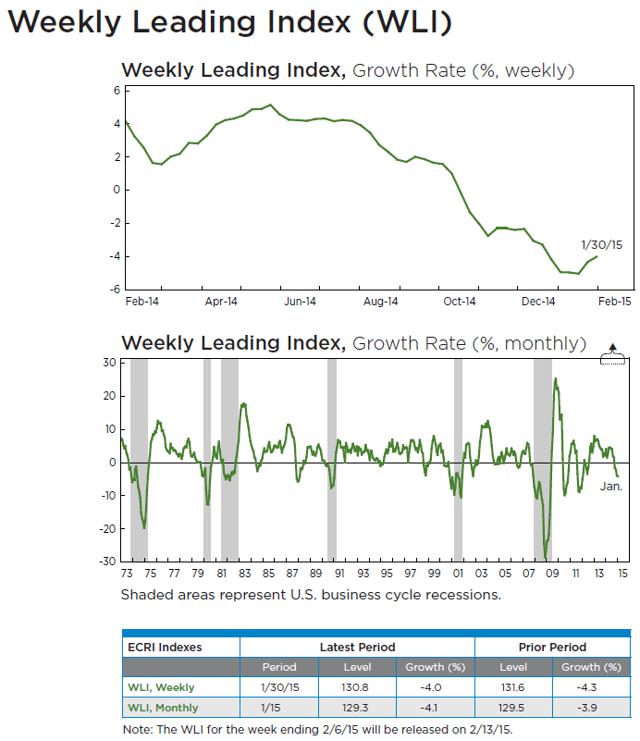
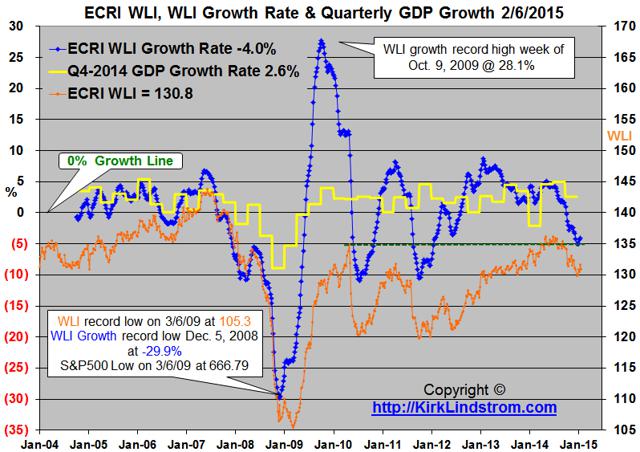
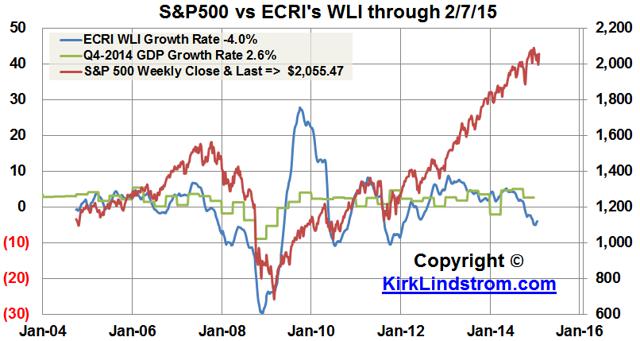
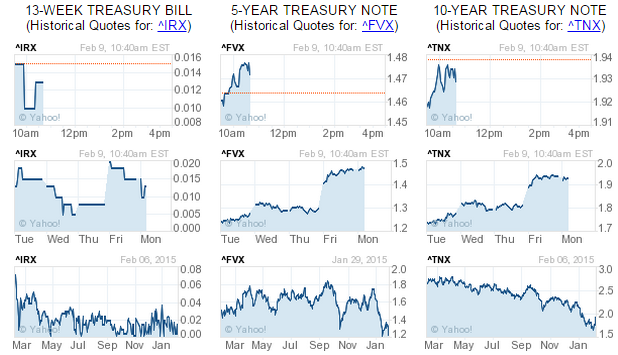
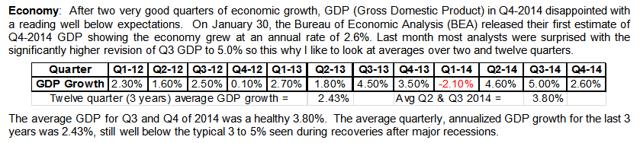
 Summary On Friday the S&P500 closed at 2,055.47, 1.8% below its record high of 2093.55. SPY closed at 205.55, 2.95% below its dividend adjusted record high of 211.80. ECRI’s WLI fell slightly while its growth rate rose to a six week high. GDP grew at an average of 3.8% for the last two quarters. The most recent estimates for GDP said the economy grew at a rate of 5.0% in Q3 of 2014 then fell nearly in half to a 2.6% rate in Q4 of 2014. While the sudden drop in Q4 GDP may have surprised many analysts and the stock markets, the decline was clearly telegraphed by ECRI’s WLI growth rate. Chart 4 in my last article relating SPY to ECRI’s Weekly Leading Index, WLI, titled ” SPY Sets Another Record High While ECRI’s WLI Growth Fell To A 2.3-Year Low ” showed the growth rate for WLI falling dramatically to a 2.3 year low. Chart 4 below shows the most recent WLI data is even lower today but still well above prior lows of the economic recovery that began in 2009. On Friday February 6, 2015, for the S&P500 index at 2,055.47 was only 1.8% below its record high of 2093.55. ECRI’s Weekly Leading Index, WLI, fell to 130.8 while its growth rate rose to a six week high of negative 4.0%. SPY , the exchange traded fund for the S&P 500, closed 2.95% below its record intraday high on Friday. (click to enlarge) Chart 1 Showing S&P500 from 1997 through February 6, 2015 (click to enlarge) S&P500 Chart Scan The latest all-time high for the S&P500 put it over 32% above its 2007 high. The stock market bears who claimed we were in a “Secular Bear Market that began in March 2000″ scared many out of the stock market. Those of us who stayed in the markets and added to positions during the downturns are also well above past highs. Table 1 showing Recent S&P500 Data In my February 2011 article ” How to Play Expected Inflation from the TIPS Spread ,” I wrote I was long SPY, as one way to benefit from expected inflation. “I also believe it is a good time to own equities including SPY, the exchange traded fund for the S&P 500, for both inflation protection and income.” I have been correct to recommend SPY here on Seeking Alpha for the past few years despite ECRI’s fears of a recession. Currently, SPY adjusted for dividends is 72% above its 2000 high with dividends reinvested . The raw price index for SPY, without dividends and shown in green on my graph below, also remains far above prior highs made in 2000 and 2007. Chart 2 Showing SPY Adjusted for Reinvested Dividends. (click to enlarge) SPY Chart Scan Table 2 showing Recent SPY Data With the markets just a few percent below record highs and the WLI growth in negative territory, the current press release from the Bureau of Economic Analysis estimates Q4-2014 GDP grew at a 2.6% annual rate. On Friday February 6, 2015, the Economic Cycle Research Institute (ECRI), a New York-based independent forecasting group, released via email its latest readings for its proprietary Weekly Leading Index (WLI) for the period ending during the prior week. In the latest release, for the week ending January 30, 2015: WLI was 130.8, down compared with the prior week at 131.6 The lowest reading for WLI on record was 105.3 for the week ending March 6, 2009. WLI growth rose to a negative 4.0% compared with the prior week of negative 4.3%. This is the least negative reading in 6 weeks when it was negative 3.3% on December 19, 2014. The lowest reading for WLI growth on record was negative 29.9% on Dec. 5, 2008. It turned higher months before the stock market bottomed on March 6, 2009, at 666.79. Occasionally the WLI level and growth rate can move in different directions, because the latter is derived from a four-week moving average . Important WLI highs for the last 6 years back to January 2008 are: May 9, 2014 = 136.3 (a 6.3 year high) January 10, 2014 = 134.2 (a 193 week high at the time) April 30, 2010 = 134.9 May 9, 2008 = 134.1 Chart 3 (click to enlarge) Annual WLI growth: Based on a simple, year-over-year annualized basis, the annual change in WLI was a negative 1.9%, down from the prior week’s reading of negative 1.6%. Chart 4 (click to enlarge) In a May 9, 2014 article ” Where Are We in Economic Cycle? ” ECRI warns that sustained 3% GDP growth will remain difficult while their belief of 2% would be what the Fed calls the “stall speed.” While the consensus keeps predicting an economy at “escape velocity,” with sustained 3%-plus growth, the reality remains far short of that, with yoy GDP growth hovering around 2% – what one quickly-forgotten Fed paper had called the economy’s ” stall speed .” Meanwhile, business investment remains elusive and – as ECRI correctly predicted last summer – construction is decelerating, not accelerating, posing risks to the economy now highlighted by Janet Yellen… There’s no indication that this era will end soon, even if we see occasional 3%-plus GDP growth quarters, given that even Japan in its “lost decades” has seen 3%-plus GDP growth in 30% of the quarters since 1990. Does SPY Lead WLI or Does WLI Lead SPY? Since ECRI releases WLI numbers for the prior week, and the stock market is known in real time, you can sometimes get a clue for next week’s WLI from the weekly change in the S&P 500 or its exchange-traded fund, SPY. But this is not always the case. Specifically, in the lead up to the last two recessions, the WLI turned down months before the stock market did. Chart 5: S&P 500 vs. ECRI’s WLI Growth Rate (click to enlarge) (Note, I would plot SPY vs. WLI, but I don’t have the weekly data in my spreadsheet going back as far since I only started trading SPY in early 2007.) Over the next 10 years, I expect the S&P 500 will keep up with inflation and the dividend it pays should grow with or even exceed inflation. An added benefit to owning equities is that the dividends and capital gains currently get favorable tax treatment. Finally, Treasury rates are artificially low (see Current U.S. Treasury Rates at a Glance ) giving all bond funds significant interest rate risk. Chart 6: Screen Shot from “Rates at a Glance” Back in 2012, when ECRI was predicting a recession , I was asked in my ” Investing for the Long Term ” Facebook group why I owned SPY: “I’m confused; if the ECRI is projecting a recession, why are you long SPY? Is it a market timing strategy?” My answer was: I don’t believe in ‘all or nothing’ market timing. I explain it more in my newsletter, but I’ll adjust my allocation to stocks based on many things including ECRI’s outlook. My last two moves for SPY was to sell SOME shares earlier this year when higher and buy them back on June 4, 2012 at $127.50 using ‘Auto Buy and Sell targets’ in my monthly newsletter. Hope that helps. (Seeking Alpha requires its writers to disclose if we hold a position. Thus, I would report I was long SPY even if SPY was only 1% of the portfolio with the other 99% in cash.) What Does The Future Hold? Last week, the DOW rose 3.8% and the S&P 500 gained 3.0% compared with the prior week. Both were less than 2% below their record closing highs. This will have a positive influence on WLI for the next weekly reading. Chart 7: Excerpt from my next newsletter showing GDP by quarter: (click to enlarge) Clearly taxing savers with massive QE by the Federal Reserve to help the government spend more than it collects appears to have worked to avoid an “official recession” during the last three years. Will ECRI be correct that sustained GDP growth over 3.0% will be difficult to maintain, especially with the end of the Federal Reserve’s QE program? What do you think? Notes VOO is Vanguard’s new exchange traded fund that tracks the S&P 500 Index. It is a lower cost alternative to SPY. I own and write about SPY, as I have many years of data for it, but VOO could do slightly better than SPY over time because it has a lower expense ratio. I trade SPY around a core position in my newsletter’s ” Explore Portfolio ” and with my personal account. With dividends reinvested, my explore portfolio holds 135.933 shares of SPY with a “break-even” price of $100.26. I also have the index fund version of SPY in both my newsletter’s “core” portfolios. ECRI uses the WLI level and WLI growth rate to help predict turns in the business cycle and growth rate cycle, respectively. Those target cycles are not the same as GDP level or growth, but rather a set of coincident indicators (including production, employment income and sales) that make up the coincident index. Based on two additional decades of data not available to the general public, there are a couple of occasions (in 1951 and 1966) when WLI growth fell well below negative 10, but no recessions resulted (although there were clear growth slowdowns). For a better understanding of ECRI’s indicators, read its book, “Beating the Business Cycle .” SPY is the exchange traded fund for the S&P 500 Index. VTI is Vanguard’s “Total Stock Market” exchange traded fund. If you want to invest in a single fund, that is my first choice over SPY. I recommend SPY and several others in my core portfolios for more opportunities to rebalance. S&P500 Chart Scan & SPY Chart Scan Disclosure : I am long SPY and own the traditional index fund versions of VTI and VOO bought long ago in various taxable and tax deferred accounts. I wrote this article myself, and it expresses my own opinions. I am not receiving compensation for it (other than from Seeking Alpha). I have no business relationship with any company whose stock is mentioned in this article. Disclosure: The author is long SPY. (More…) The author wrote this article themselves, and it expresses their own opinions. The author is not receiving compensation for it (other than from Seeking Alpha). The author has no business relationship with any company whose stock is mentioned in this article. Scalper1 News
Scalper1 News