Scalper1 News
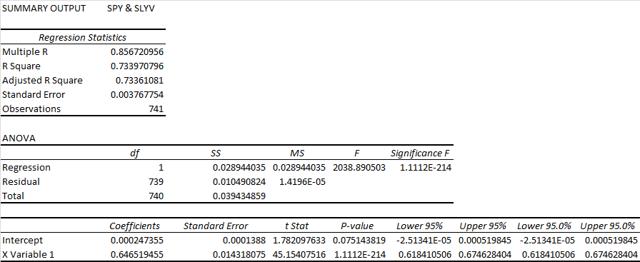
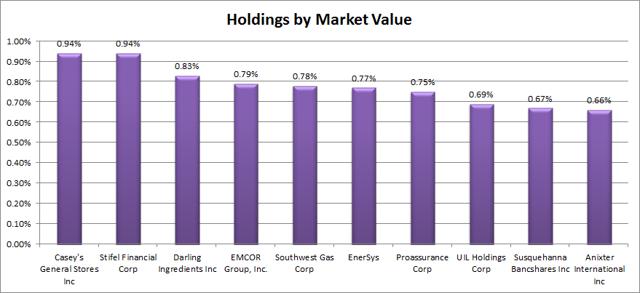 Summary I’m taking a look at SLYV as a candidate for inclusion in my ETF portfolio. The expense ratio is a tad high, but diversification isn’t bad. The correlation with SPY isn’t bad, but the daily returns are more volatile than SLYG. I don’t think I’ll be using SLYV in the foreseeable future. I’m not assessing any tax impacts. Investors should check their own situation for tax exposure. Investors should be seeking to improve their risk adjusted returns. I’m a big fan of using ETFs to achieve the risk adjusted returns relative to the portfolios that a normal investor can generate for themselves after trading costs. I’m working on building a new portfolio and I’m going to be analyzing several of the ETFs that I am considering for my personal portfolio. One of the funds that I’m considering is the SPDR® S&P 600 Small Cap Value ETF (NYSEARCA: SLYV ). I’ll be performing a substantial portion of my analysis along the lines of modern portfolio theory, so my goal is to find ways to minimize costs while achieving diversification to reduce my risk level. What does SLYV do? SLYV attempts to provide results which are comparable (before fees and expenses) to the total return of an unnamed index that tracks small capitalization “value” equity securities in the U.S. By not defining a specific index, it would be difficult for SLYV to fall short of that objective. It may sound like I’m unimpressed with the fund before I even begin the analysis. To an extent, that’s true. I want to see a specific index named so that investors can check how accurately the ETF is tracking that index. I checked the official prospectus to see if there was a mistake. It seems there really is no defined index. SLYV falls under the category of “Small Value”. Does SLYV provide diversification benefits to a portfolio? Each investor may hold a different portfolio, but I use (NYSEARCA: SPY ) as the basis for my analysis. I believe SPY, or another large cap U.S. fund with similar properties, represents the reasonable first step for many investors designing an ETF portfolio. Therefore, I start my diversification analysis by seeing how it works with SPY. I start with an ANOVA table: (click to enlarge) The correlation is about 85.6%, which is great for Modern Portfolio Theory. The lower correlation makes it much easier to mix the ETF into a portfolio and take advantage of the benefits of diversification. My goal is risk adjusted returns, and my method is minimizing risk. Standard deviation of daily returns (dividend adjusted, measured since January 2012) The standard deviation is moderately high, but not terrible. For SLYV it is .9673%. For SPY, it is 0.7300% for the same period. SPY usually beats other ETFs in this regard, and the low correlation with SPY makes the higher standard deviation acceptable. Mixing it with SPY I also run comparisons on the standard deviation of daily returns for the portfolio assuming that the portfolio is combined with the S&P 500. For research, I assume daily rebalancing because it dramatically simplifies the math. With a 50/50 weighting in a portfolio holding only SPY and SLYV, the standard deviation of daily returns across the entire portfolio is 0.8183%. If an investor wanted to use SLYV as a supplement to their portfolio, the standard deviation across the portfolio with 95% in SPY and 5% in SLYV would have been .7354%. Ironically, when I compared the growth version of this fund (NYSEARCA: SLYG ), which is very similar except for investing in “growth” securities, SLYG had lower correlation and a lower standard deviation of returns. I would have expected SLYG to have lower correlation than SLYV, but I would not have expected it to exhibit a smaller standard deviation of returns. In short: SLYV performed worse on both risk metrics than SLYG. Liquidity The average trading volume was a little over 30,000 shares, which is high enough that I’m not concerned. Why I use standard deviation of daily returns I don’t believe historical returns have predictive power for future returns, but I do believe historical values for standard deviations of returns relative to other ETFs have some predictive power on future risks and correlations. Yield & Taxes The distribution yield is 1.36%. The SEC yield is 1.37%. That yield isn’t terrible, but investors won’t be able to retire on yields that are significantly under 2%. In my opinion, this is a difficult space for an ETF to be in. The “value” realm can be associated with less volatility and higher yields which make it more appealing for retirees. This “value” ETF doesn’t have enough yield to be strong in the category but offered more volatility and correlation to SPY than the growth ETF. I’m not a CPA or CFP, so I’m not assessing any tax impacts. Expense Ratio The ETF is posting .25% for an expense ratio. I want diversification, I want stability, and I don’t want to pay for them. The expense ratio on this fund is not too bad, but I’d like to see it lower for an ETF that invests in U.S. equity securities. Market to NAV The ETF is at a .17% premium to NAV currently. Premiums or discounts to NAV can change very quickly so investors should check prior to putting in an order. I wouldn’t want to pay a premium greater than .1% when investing in an ETF, unless I could find a solid accounting reason for the premium to exist. Largest Holdings Just like SLYG, the diversification is fairly solid. No investment is over 1% of the portfolio, but that also isn’t diversified enough to explain the .25% expense ratio. (click to enlarge) Conclusion I’m currently screening a large volume of ETFs for my own portfolio. The portfolio I’m building is through Schwab, so I’m able to trade SLYV with no commissions. I have a strong preference for researching ETFs that are free to trade in my account, so most of my research will be on ETFs that fall under the “ETF OneSource” program. I just don’t see enough benefits to SLYV to try to use it in the portfolio. Due to the low correlation, an investor may find a 1% exposure to be very reasonable. For me, 1% simply isn’t large enough when investing in ETFs. Additional disclosure: Information in this article represents the opinion of the analyst. All statements are represented as opinions, rather than facts, and should not be construed as advice to buy or sell a security. Ratings of “outperform” and “underperform” reflect the analyst’s estimation of a divergence between the market value for a security and the price that would be appropriate given the potential for risks and returns relative to other securities. The analyst does not know your particular objectives for returns or constraints upon investing. All investors are encouraged to do their own research before making any investment decision. Information is regularly obtained from Yahoo Finance, Google Finance, and SEC Database. If Yahoo, Google, or the SEC database contained faulty or old information it could be incorporated into my analysis. The analyst holds a diversified portfolio including mutual funds or index funds which may include a small long exposure to the stock. Scalper1 News
Scalper1 News