Scalper1 News
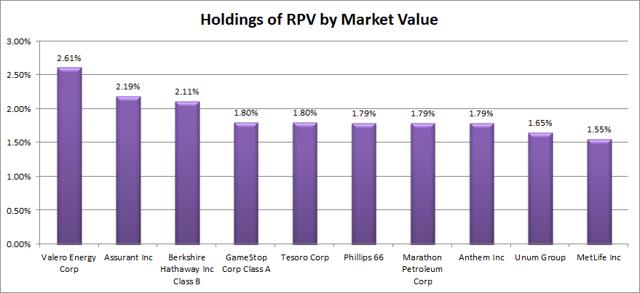 Summary The performance of the ETF has been fairly solid. The standard deviation gives it some risk, but not too much. The holdings of the ETF are at least adequately diversified and I like the positions. The decent liquidity doesn’t hurt when investors want to rebalance their portfolios. The Guggenheim S&P 500® Pure Value ETF (NYSEARCA: RPV ) has surprised me. With a higher turnover ratio and expense ratio, the fund has thoroughly outperformed SPY since inception. During the time frame I used for my regression, RPV was up 119% relative to the SPDR S&P 500 Trust ETF (NYSEARCA: SPY ) being up 96%. Impressive work and great for the people that decided to buy into it when the ETF started. What does RPV do? RPV attempts to track the investment results of S&P 500 Pure Value Index. The ETF falls under the category of “Large Value” presently, but was classified under “Mid-Cap Value” previously. The category may be prone to change as the ETF has a 25% portfolio turnover. Does RPV provide diversification benefits to a portfolio? Each investor may hold a different portfolio, but I use SPY as the basis for my analysis. I believe SPY, or another large cap U.S. fund with similar properties, represents the reasonable first step for many investors designing an ETF portfolio. Therefore, I start my diversification analysis by seeing how it works with SPY. The correlation is about 88.86%, which is low enough to allow more diversification benefits than I would expect in a fund referencing the S&P 500. Standard deviation of monthly returns (dividend adjusted, measured since March, 2006) The standard deviation is terrible. If investors want to ensure that they are keeping volatility out of their portfolio, this won’t be the ETF. That’s a little ironic to me because over long sample periods I wouldn’t expect a value ETF to show so much more volatility than SPY. For the period I’ve chosen, the standard deviation of monthly returns was 7.021%. For SPY, it was 4.416% over the same period. Mixing it with SPY I also run comparison on the standard deviation of monthly returns for the portfolio assuming that the portfolio is combined with the S&P 500. For research, I assume monthly rebalancing because it dramatically simplifies the math. With a 50/50 weighting in a portfolio holding only SPY and RPV, the standard deviation of monthly returns across the entire portfolio is 5.566%. If the position in SPY is raised to 80% while RPV is used at 20% the standard deviation of monthly returns drops down to 4.824%. In practice, I think the best way to use RPV is a position smaller than 20% and used in a diversified portfolio. The moderate correlation makes a strong case for using RPV in a small position so the volatility has less impact on the overall portfolio. At 5%, the standard deviation of the portfolio would have been 4.510%. Compared to SPY at 4.416%, this is a fairly low increase in the risk level measured by the standard deviation. Why I use standard deviation of monthly returns I don’t believe historical returns have predictive power for future returns, but I do believe historical values for standard deviations of returns relative to other ETFs have some predictive power on future risks and correlations. Yield & Taxes The distribution yield is 1.98%. It’s a little on the low side for the value focus, but not too low if it is only being considered for a portion of the portfolio. Due to the higher volatility of returns on this “value” ETF, I really appreciate seeing a higher distribution yield. The major risk, in my opinion, is that investors tend to withdraw their money at the worst possible times. Expense Ratio The expense ratios are both running .35%. It isn’t too bad and seems to be the standard for Guggenheim ETFs. I’d prefer lower, but this is still within reason. Market to NAV The ETF is trading at a .06% discount to NAV currently. I think any ETF is significantly less attractive when it trades above NAV and more attractive below NAV. A .06% discount is not enough to matter though. Investors should check prior to placing an order, but the liquidity in RPV should be a great hedge against any meaningful premiums or discounts. Lately there have been more than 120,000 shares trading hands each day. With each share over $50, the resulting liquidity is enough that I would have no concerns. Largest Holdings The diversification is pretty good. I see nothing to complain about here. (click to enlarge) Conclusion RPV delivers a strong showing in my initial assessment. The liquidity is excellent and the correlation is about what I would expect for the ETF having a focus on the S&P 500 index. The performance was fairly solid over the test period in every regard. The biggest weakness would have to be the volatility of returns, but that sure won’t stop the ETF from reaching the next stage. The Guggenheim S&P 500 Pure Growth ETF (NYSEARCA: RPG ) tracks the other side of the index, having a focus on growth stocks. The interesting thing is over the last five years both RPV and RPG significantly outperformed SPY. If we limit the comparison to the last 5 years, SPY was up 111.5%, RPG was up 148.2% and RPV was up 134%. When I looked up the ETF they were holding 119 of the constituents of the S&P 500. Frequently the contenders for the value exposure in my portfolio will have fairly strong dividend yields. The yield on RPV isn’t that strong, but that seems like a fairly minor issue for me since I don’t anticipate any withdrawals from the portfolio for a long time. Within the 119 companies, the diversification isn’t bad. Only one holding was over 2.02% and I can’t complain about the selections. All around, I feel like this is a fairly solid group of companies the ETF is holding. The expense ratio is not too bad, cheaper than most though a certainly higher than my goals. I’m certainly willing to deal with that if the ETF fits nicely into my overall portfolio. Disclosure: I/we have no positions in any stocks mentioned, and no plans to initiate any positions within the next 72 hours. (More…) I wrote this article myself, and it expresses my own opinions. I am not receiving compensation for it (other than from Seeking Alpha). I have no business relationship with any company whose stock is mentioned in this article. Additional disclosure: Information in this article represents the opinion of the analyst. All statements are represented as opinions, rather than facts, and should not be construed as advice to buy or sell a security. Ratings of “outperform” and “underperform” reflect the analyst’s estimation of a divergence between the market value for a security and the price that would be appropriate given the potential for risks and returns relative to other securities. The analyst does not know your particular objectives for returns or constraints upon investing. All investors are encouraged to do their own research before making any investment decision. Information is regularly obtained from Yahoo Finance, Google Finance, and SEC Database. If Yahoo, Google, or the SEC database contained faulty or old information it could be incorporated into my analysis. Scalper1 News
Scalper1 News