Scalper1 News
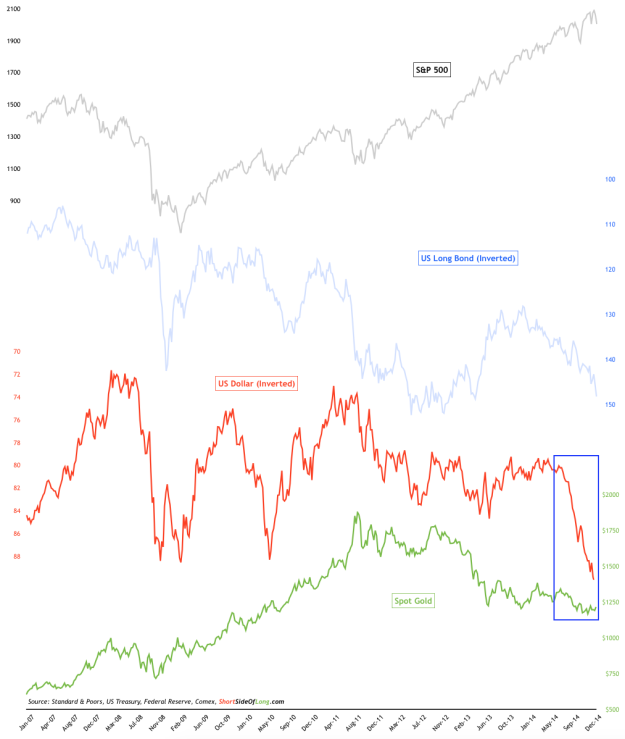
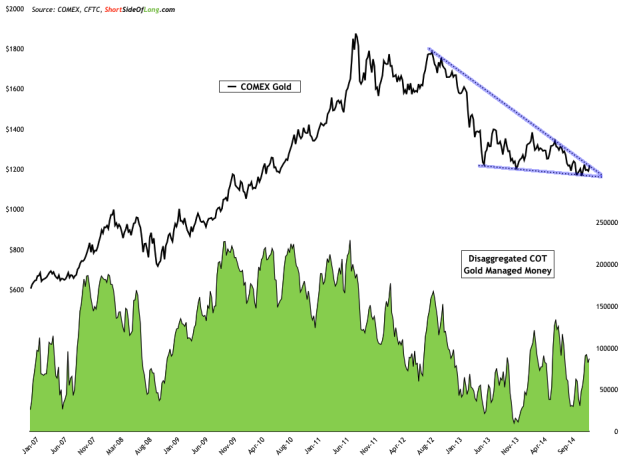
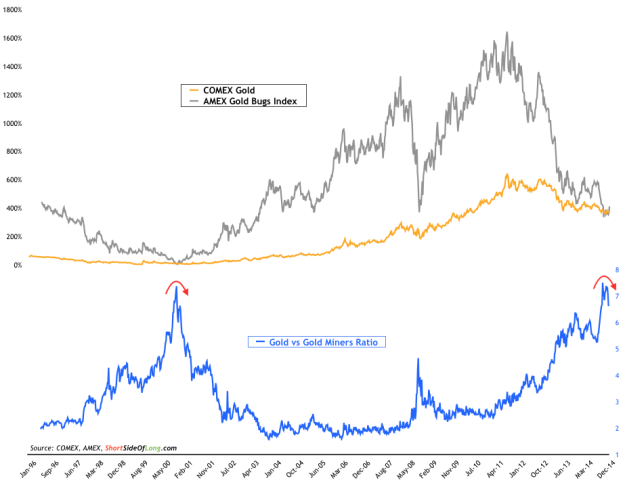
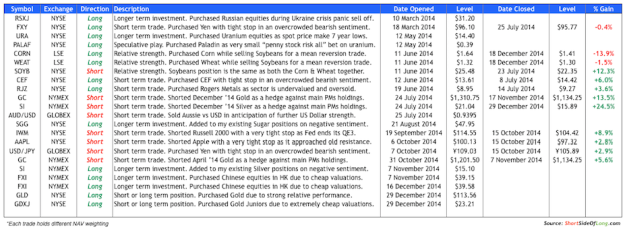 Please note that this post is a little outdated due to the recent holiday break. Usually, I try to update the trades opened within the 24 hours from execution, but in recent times I haven’t been anywhere near the office (apart from an hour here or there). I did open two new trades just before New Year’s eve, so here is the update as well as a brief thinking process. Chart 1: Gold has shown incredible relative strength during the USD rally! Source: Short Side of Long Unless you have been living in a cave or under a rock, you surely would have noticed the amazing strength the U.S. Dollar has been showing in recent months. Whether it’s against the majors like the Euro, the Yen or the Australian dollar, or EM currencies such as the Ruble or Real, the greenback has been making up some serious ground. If we observe Chart 1, we should be able to see four major global macro asset classes: S&P 500, Treasury Long Bond, USD Index and Gold. Let us not focus on the stock and bond market for a second, and only pay attention to the recent action in the U.S. Dollar (inverted on the chart) and Gold. Majority of the time, negative correlation between the USD and Gold is high. So in plain English, usually but not always, Gold moving up means the U.S. Dollar is moving down, and vice versa. What should grab all of our attention is how powerful the recent USD rally has been and yet Gold has held its own (observe the blue box in Chart 1). Chart 2: Price is compressed in a technical triangle and it’s decision time Source: Short Side of Long The fact that Gold has barely sold off and still remains above $1,200 per ounce, at a similar price where it traded 18 months ago, indicates relative strength and buying interest. Other commodities, such as Crude Oil, have not been as lucky with greenback moving up so high. Eventually the U.S. Dollar rally will pause and take a breather, because nothing can keep rising vertically forever. It is my view that Gold will outperform when that time comes. Now… most trades would like to know when that will happen. Because I do not have a crystal ball, I cannot answer that question like other so-called “experts.” But what I can say is that the current price action in Gold shows a major compression in the form of a technical triangle. This pattern is edging closer and closer to a break in either direction, which should give us further clues (refer to Chart 2). I believe this break will be on the upside and I recently purchased some Gold via the SPDR Gold Trust ETF ( GLD). Depending on how the price behaves, this could either just be a short-term trade or a longer-term investment. Chart 3: Miners have been terrible performers since 2011 and appear cheap Source: Short Side of Long Furthermore, Gold Miners have become extremely oversold and now trade at dirt-cheap valuations. When compared to the Gold price itself, miners trade at the biggest discount since 2000… around the time the last major precious metals bull market started (please see Chart 3). This is even more true when we look at the Market Vectors Junior Gold Miners ETF ( GDXJ), which is down by almost 89% from the highest high in late 2010. I’ve started a small position here to test the waters (similar to Russia and Uranium if you refer to Chart 4). Also worth an important mention, I have closed my major hedge on Silver, which was originally opened in early July of 2014 just above $21 per ounce. This was one of my biggest trades in recent times and a gain of 24.5% is really, really huge. I plan to use these profits to purchase more PMs and average down my previous positions, which sit underwater. Moreover, despite a huge rally in the U.S. Dollar, I will continue to hold all my cash in this currency for the time being. My shorts on the Aussie Dollar also remain in place for now. Finally, the only other position I have opened recently is the Chinese H shares bet, but more on that in another post. Chart 4: Recent additions to the portfolio are PMs and Chinese stocks Source: Short Side of Long Disclosure: Biggest trades in the portfolio are long Precious Metals, long Chinese equities, short Australian Dollar and finally cash held in U.S. Dollar currency. Link to the original article on The Short Side Of Long Scalper1 News
Scalper1 News