Scalper1 News
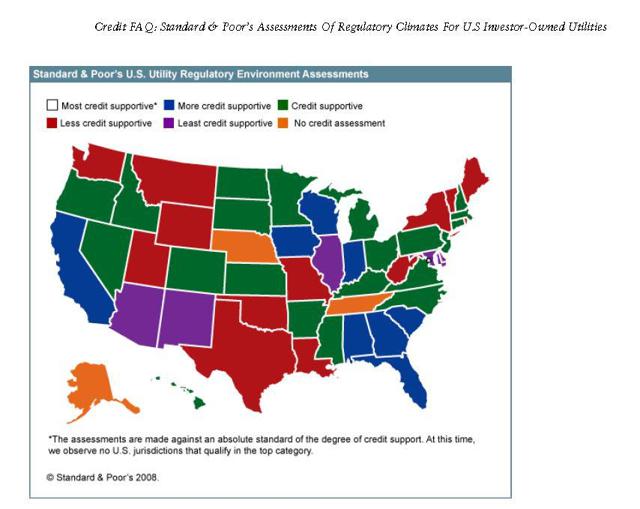
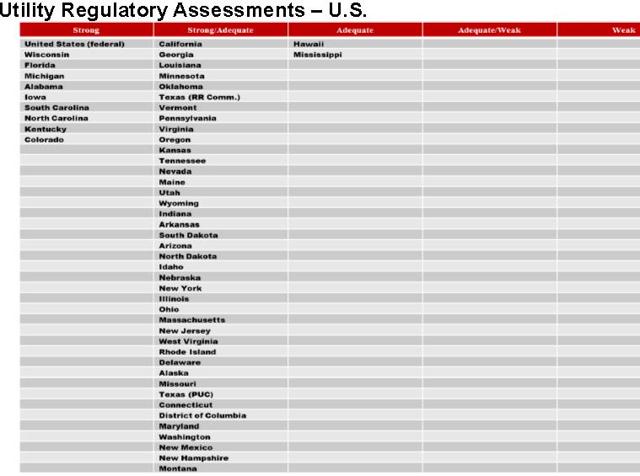
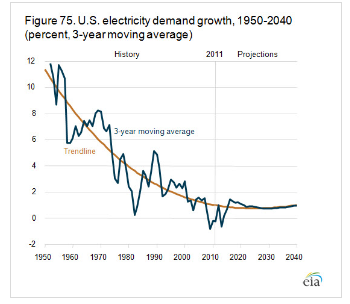
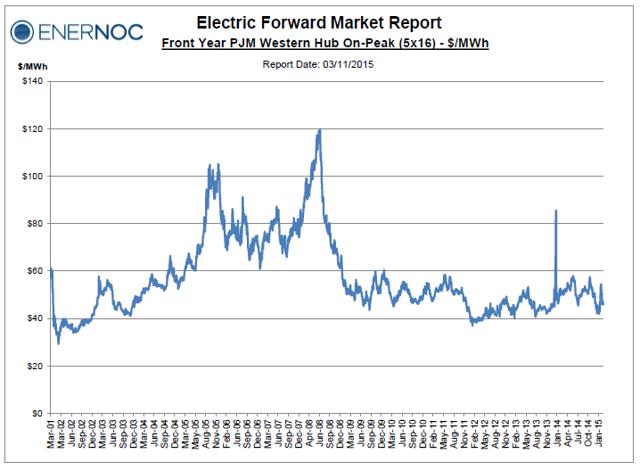
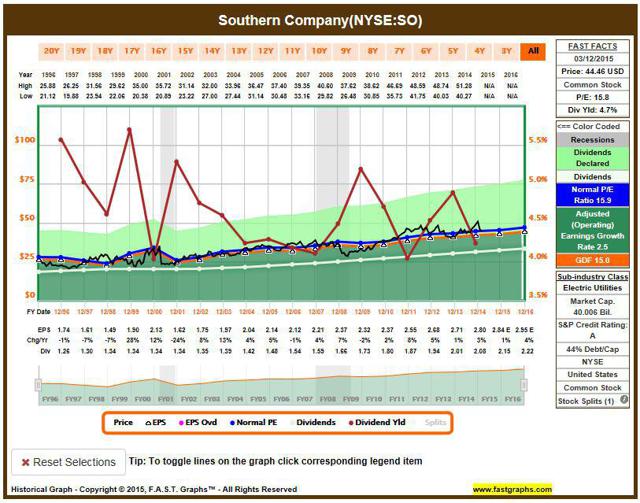 Diversification within the sector is easy to obtain, as there are plenty of utilities to choose from. There is no need to pay management fees or to gain exposure to unrealized mutual fund capital gains for either a utility ETF or mutual fund. Net ROIC, or ROIC minus WACC, is an interesting matrix in utility stock research and should be considered. Chuck Carnevale published a great article on SA last week. It focuses on the “overlooked dangers when investing in utility stocks” and should be read by all utility investors. Thanks to Mr. Carnevale for his continuing series of educational articles on investing and on his current review of the ten industrial sectors. There were several comments concerning the process of developing a portfolio of utility stocks. My initial assumption begins with the belief that developing a portfolio of utility stocks is not difficult and is preferred to buying an open-end or closed-end mutual fund or an ETF. According to ETF database, there are 21 flavors of utility ETFs; according to Closed End Fund Advisors, there are 12 choices of utility closed-end funds; and according to Morningstar, there are 18 open-end utility mutual funds selections, increasing to 65 when various stock classes of each are included. These ETFs and funds have various specialties from country specific international funds to return of capital income funds. I like Mario Gabelli’s discussion of the utility sector and his belief the industry consolidation that is decades old will continue. According to his latest annual report, there are 60 publicly traded US electric utilities and 30 natural gas utilities, which represent 50 more than needed. More of Mr. Gabelli’s comments can be found in the 2014 annual report (pdf). Most utility investors should read his comments as it offers a unique view of the sector. The basic tenet of developing a diversified portfolio of utility stocks is to understand the differences of each and to have a broad base to start. While utilities are usually lumped together, there are subtle differences between the various utility companies. Much like a series of funnels, each criterion will further limit the selection process. For example, the initial basic screen would be the type of utility as follows: Diversified utilities – companies with assets crossing several utility types, such as a merchant power producer, which also owns regulated utilities or a utility servicing both electric and natural gas customers. Merchant power utilities – companies with a primary focus on generating electric power that usually is sold in the unregulated markets. Regulated utilities, electric – electric companies who have traded a geographical monopoly for regulated prices set either by state or Federal regulatory bodies. Regulated utilities, natural gas – natural gas companies who have traded a geographical monopoly for regulated prices set by state. Regulated utilities, water – water companies who have traded a geographical monopoly for regulated prices set by state regulatory bodies. Each of these sub-sectors has their own attributes and issues. For example, historically the highest yielding stocks fall in the regulated electric utility sector while the lowest are usually found with natural gas and water stocks. The largest area of unregulated assets falls in the merchant power industries where electricity is generated and sold using short-term spot, medium-term auction, or long-term purchase power agreement processes. It is important for investors to realize the amount of control regulators have over the performance of shareholders’ investments. Regulated assets can be split between state regulated and federally regulated with the feds usually controlling the transmission of high voltage electricity and major natural gas pipelines. Most of the federally regulated assets usually reside in much larger utilities. For example, American Electric Power (NYSE: AEP ) operates the largest network of federally regulated electricity transmission assets. The only independent federally regulated transmission utility is ITC Holdings (NYSE: ITC ). State regulatory agencies usually set the pricing terms for the balance of other assets. The federal government wants higher capital investments in the transition and electric grid business and to accommodate these goals, federal regulators allow a higher return on investments than many states. Each state offers a slightly different calculation for the allowed return. A great industry research resource is the Edison Electric Institute, a trade group offering in depth information on regulators. EEI.com offers a host of financial trends from rate cases, allowed returns, dividends, and credit ratings. For example, eei.com offers a 24-year chart of the average allowed ROE for state regulated assets, updated quarterly. As shown, since 2012, the allowed returns has been pretty stagnate at 10% and below 10.5% since 2006. The following chart is from EEI’s 2014 third qtr. rate summary review pdf. As part of their company specific credit analysis, S&P Credit offers additional insight into the regulatory environment by state. With profitability capped by regulators, a company’s credit risk profile should include how “friendly” the regulators are. In 2008, S&P Credit published the following map of their utility regulatory environment assessment. The states were categorized effectively four categories and no assessment. (click to enlarge) In 2014, S&P updated the list and reduced the effective number of categories to three as follows: (click to enlarge) Personally, I find the transformation of assessment categories quite interesting. The usefulness of the list seems to have been diminished as 88% of states listed are in the middle category. With state regulators having great influence over the profitability of utilities under its jurisdiction, it is important to appreciate the underlying regulatory environment. The more friendly the environment, the better the potential for improved shareholder returns. If regulated returns are relatively flat, earnings and dividend growth would then need to come from a larger regulated asset base and a growth in demand. A larger regulated assets base is generated through higher capital investment in projects that are approved by regulators. Over time, the amount of capital expenditures by utility companies will drive earnings higher by an average of 4% to 6% annually. According to a study by eei.org, the electric utility industry alone will need to invest $1.5 trillion to $2.0 trillion in infrastructure over the next 15 years. Of this amount, 58% could in regulated transmission and distribution investments and 30% in new and updating power generation. The underlying growth in utility demand is 1% to 2% annually, with utility demand following underlying economic growth. Trends in geographical industrial expansion translate into organic profit growth by utilities. For example, the economy of the southeast is usually considered a faster growth area than the Great Lakes region and this will show up in higher earnings growth potential for utilities servicing Florida than Detroit. Below is a chart of electricity demand from 1950: Some investors could be seeking regulated electric utilities, for higher yield, with state regulated assets in the southeast, due to a potentially friendlier regulatory environment and underlying economic growth. A potential list of these stocks would include Southern Company (NYSE: SO ), SCANA Corp (NYSE: SCG ), and Duke Energy (NYSE: DUK ). A list of utilities within a specific state’s jurisdiction is usually published at the regulators website. For example, California offers a map of the state outlining the service territory of the major providers. A similar list can be developed for each sub-sector. Some investors may want geographical diversification and when researching, different states could be reviewed. For example, natural gas utilities servicing Florida, Iowa, Colorado and Kentucky (those listed as having friendlier regulatory environments) include privately held MidAmerican Utilities and EQT Corp (NYSE: EQT ). Water utilities offer a much narrower choice with all companies being either small or mid-caps and the vast majority of water districts are still owned by municipalities. The largest independent US water utilities, by market cap, are American Water Works (NYSE: AWK ) and Aqua America (NYSE: WTR ). Unregulated merchant power producers are directly affected by the commodity price of electric power, and both can be volatile. In the Northeast and eastern Midwest, power is sold mainly using a 3-yr rolling auction process while in the south power is usually sold using long-term purchased power agreements of upwards of 20 years. For example, below is a 15-year chart of the 1-year forward price of power at PJM’s Western Hub, from Erie, PA to Washington DC, as offered by consulting firm Enernoc. (click to enlarge) Natural gas fueled Calpine (NYSE: CPN ) and smaller geothermal Ormat Technologies (NYSE: ORA ) are two examples of merchant power producers. E&E Publishing offers an in-depth article from last fall that differentiates two major merchant power producers with diverse business models — Dynegy (NYSE: DYN ) and NRG (NYSE: NRG ). After a list of potential stocks is developed, determining the most suitable comes next. It is important for the portfolio not only to include multiple segments of the utility sector, but several choices within the segment as well. The final choices should fit into the risk profile and investment strategy of each individual investor. For example, dividend growth investors may want to focus on the 3-yr or 5-yr growth of dividend while income investors may select stocks with the highest current yield. However, there are a few specific attributes that all investors should review and include analysis of return on invested capital. Return on invested capital ROIC is an important fundamental attribute for capital-intensive companies such as utilities. Return on equity ROE evaluates management effectiveness based on profits generated in relationship to equity deployed while ROIC evaluates management effectiveness based on the total capital structure at their disposal — equity and debt combined. While not the only criteria to consider, over the long term higher than average ROIC means management has the proven their ability to generate profits better than competitors did. The average ROIC is around 5%. However, it is important to appreciate that a high ROIC does not guarantee higher stock returns, just that the management team is potentially better at generating profits than others are. Another matrix is the appreciation of returns on capital vs. the cost of capital. The best companies over time generate returns on their total capital structure in excess of the cost of the same capital. ThatWACC.com offers the complex calculations of WACC, or weighted average cost of capital, by ticker symbol. The goal is to find management teams that generate a positive Net ROIC, or ROIC minus WACC. For example, Exelon (NYSE: EXC ) has generated a 5-yr average ROIC of 7.4% and has a WACC of 4.7%. By comparison, Duke Energy has a 5-yr average ROIC of 4.3% and a WACC of 3.3% and PPL Corp (NYSE: PPL ) has a 5-yr average ROIC of 6.4% and a WACC of 4.8%. There are many utilities that do not generate ROIC in excess of their WACC. Some investors are drawn to quality management teams. S&P offers a rating of 10-year performance of earnings and dividend growth called the “Quality Rating.” These two attributes are critical for many investors, and ratings range from A+ to D-, with B+ considered average. The only A+ rated utility company is Entergy (NYSE: ETR ). Below are utilities rated A. AGL RESOURCES INC. GAS AMERICAN STATES WATER CO AWR AQUA AMERICA INC WTR CHESAPEAKE UTILITIES CORP. CPK ITC HOLDINGS CORP ITC NEXTERA ENERGY INC NEE NORTHWESTERN CORP NWE PIEDMONT NATURAL GAS CO INC. PNY WISCONSIN ENERGY CORP WEC YORK WATER COMPANY ( THE ) YORW Some investors look at dividend yield as a measure of value. When the current yield is at a level that is higher than its average 5-yr yield, the stock can be considered to be ripe for purchase. For example, according to reuters.com, the 5-yr average yield for Southern Company is 4.46%, and is right at its current yield of 4.57%. Fastgraphs.com offers a new intriguing option, which is a history of dividend yields. Below is a chart of SO’s dividend yield, courtesy of fastgraphs.com. (click to enlarge) As shown by the red line, the yield on SO has been up and down. The average peak in yield going back to 1996, and its corresponding low stock prices, is 5.3%. The yield has peaked 5 times over the previous 20 years, and a buy in price at the average peak could be considered a historically good entry point. As Mr. Carnevale points out, current valuations are extended and yields are subdued compared to historic numbers. There has been a pullback in most utilities over the past month, and especially since the recent employment numbers came out, fueling thoughts of a turn in the interest rate cycle. The current utility stock slide has brought some selections back to more reasonable valuations. Based on history, utility stock prices are more sensitive to interest rate declines at the top of the rate cycle than interest rate increases from the bottom of the cycle. More on this can be found in my article from last July titled, Utilities and Rising Interest Rates: Fact or Fiction. Author’s Note: Please review disclosure in Author’s profile. Disclosure: The author is long AEP, EXC, SO, ITC. (More…) The author wrote this article themselves, and it expresses their own opinions. The author is not receiving compensation for it (other than from Seeking Alpha). The author has no business relationship with any company whose stock is mentioned in this article. Scalper1 News
Scalper1 News