Scalper1 News
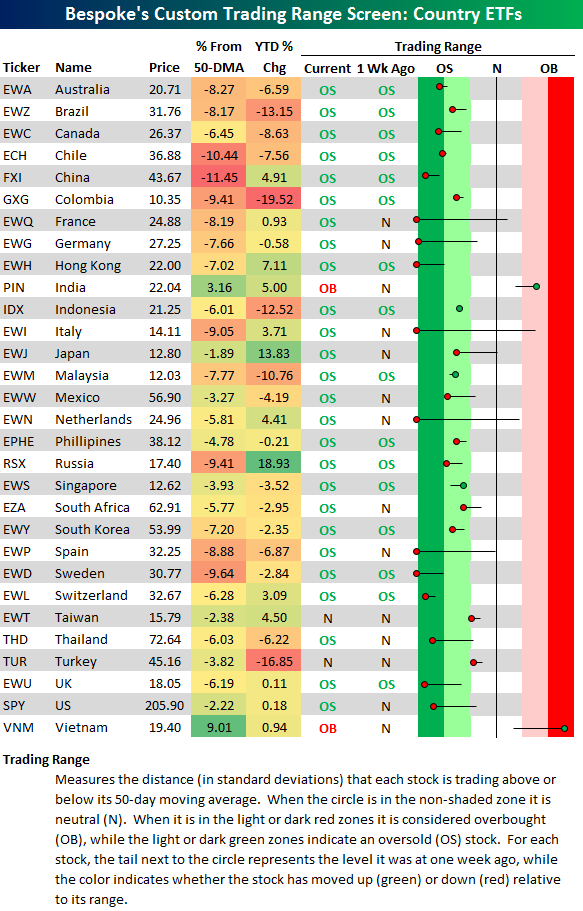
 Greece has roiled global equity markets for the time being, and you can see the recent drop in our trading range screen of the 30 largest country ETFs. For each country ETF, the dot represents where it is currently trading, while the tail end represents where it was trading one week ago. The black vertical “N” line represents each ETF’s 50-day moving average, and moves into the red or green zones are considered overbought or oversold. As of Monday afternoon, 26 of the 30 country ETFs in our screen were in oversold territory, with France (NYSEARCA: EWQ ), Germany (NYSEARCA: EWG ), Hong Kong (NYSEARCA: EWH ), Italy (NYSEARCA: EWI ), the Netherlands (NYSEARCA: EWN ), Spain (NYSEARCA: EWP ) and Sweden (NYSEARCA: EWD ) all at extreme levels of 3 or more standard deviations below their 50-days. The US (NYSEARCA: SPY ) is deeply oversold now as well. Interestingly, three countries have managed to buck the trend recently and head higher – India ( PIN , INP ), Singapore (NYSEARCA: EWS ), and Vietnam (NYSEARCA: VNM ). After experiencing a nasty downtrend for months, India’s stock market has actually broken higher above the top end of its downtrend channel recently. Share this article with a colleague Scalper1 News
Scalper1 News