Scalper1 News
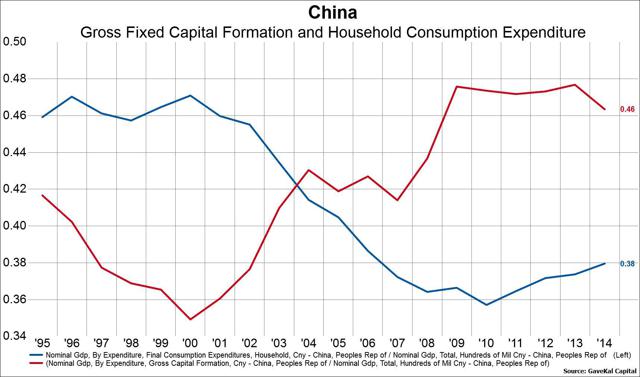
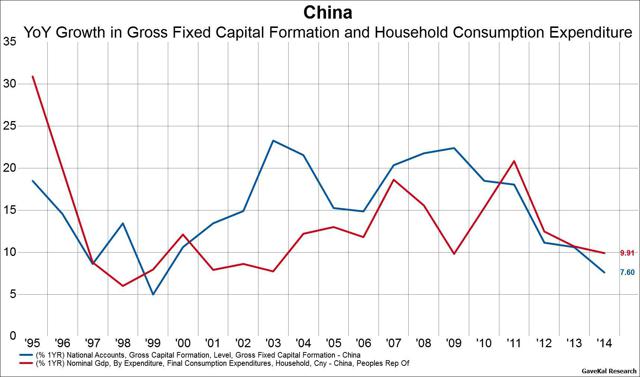
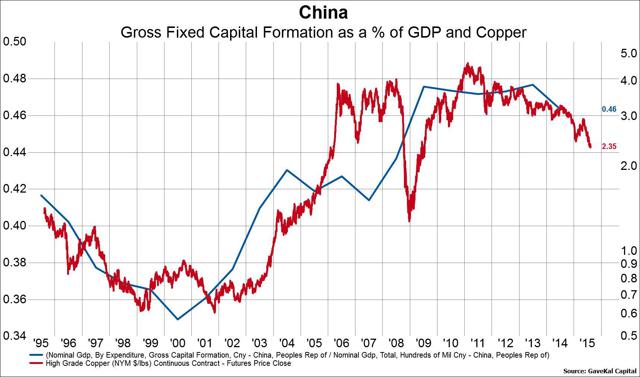
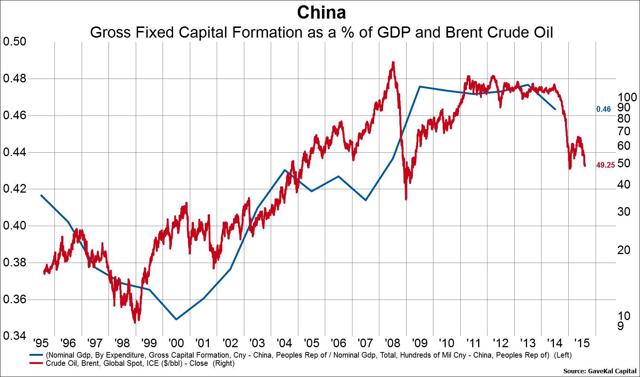
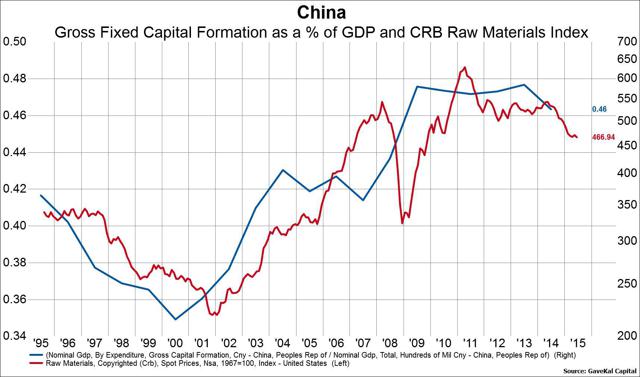

 China’s economy is in the midst of a transition from an investment led growth model to a consumption led growth model. This week has seen what we believe to be an acceleration of this transition with the slight altering of China’s currency peg to the US dollar. China’s investment share of GDP must fall from 48% to 35% while consumption rises from 38% to closer to 50%, and it could take a decade. There will be winners and losers on both sides with consumer oriented plays benefiting while commodity oriented plays get pinched. Change can be hard, but change can also be good. At this very moment we are living through one of the largest and potentially destabilize periods of economic change in the last century. It is the mirror image and reversal of the last great economic paradigm shift. It is China’s shift from an investment driven growth model to a consumption driven growth model. For some it is painful. For others who are correctly positioned it is extremely lucrative. It is affecting all of us whether we know it or not. But most of all, it is inevitable. This week has seen what we believe to be an acceleration of this change. China continued to make baby steps towards liberalizing its financial system by altering – slightly – the defacto peg to the US dollar. China is notorious for “feeling the stones as [they] cross the river”, and this latest currency regime shift is just one stone of many that will eventually lead to a much more open and consumption driven economy, but it will take years. To be clear, when we say that China is shifting from an investment led economic growth model to a consumption led model, we are referring to a literal flip flop in the share of investment and consumption as a percent of GDP. As the first chart below shows, from 2000-2013, investment as a percent of China’s GDP grew from 35% to 48%. Meanwhile, consumption as a percent of GDP fell from 47% to a low of 36%. There is no correct ratio of investment as a percent of GDP, but many emerging market countries run at about 35%. This is because sustaining an abnormally high investment share of GDP – say around 48% as China has done – for a long period of time requires a massive buildup of debt which has practical limits. China is undergoing this uncomfortable shift in its economy and it will likely take a decade to get there. In the meantime, there are plenty of consequences, both good and bad, for stakeholders. (click to enlarge) From an arithmetic perspective, transitioning from 48% investment to 35% investment and from 36% consumption to 47% consumption requires three things. First, growth in investment (think infrastructure/property development) must slow dramatically from a 20% plus pace to a low single digit pace and then stay at that low single digit growth rate for some time. Second, growth in consumption expenditure must rise from the current rate of about 10% to somewhere closer to 20% and then continue to grow at 20% for some time. Third, the overall growth rate of the economy must fall from the current 7% rate to something closer to 3-4%, if not lower. In extremely simple terms, the growth rate of rail lines, apartment buildings, the occasional empty city, and everything required to make those things must fall dramatically while the growth rate of things like spending on consumer goods and health care must rise dramatically. As the next chart below demonstrates, China has made a good amount of progress on the investment side (but mind you many, many more years of even lower investment growth are ahead of us), but consumption has yet to see its required growth spurt. (click to enlarge) One of the most obvious consequences of the requisite slowdown in the rate of investment growth is the practically assured collapse in commodity prices, as we have seen. Indeed, the price of oil, copper, and raw materials more generally have been highly correlated to China’s investment share of GDP, as the next three charts below demonstrate. As China’s transition continues to play out over the next number of years, the probability of continued weakness in commodities will remain elevated. Remember, this is a potentially decade-long process that has according to our interpretation of the data just begun. (click to enlarge) (click to enlarge) (click to enlarge) On the flip side of the equation, we should also be seeing healthy growth rates in companies catering the Chinese consumer, and we are. In the two tables below we categorize all non-financial non-utility companies in the China Securities Index 300 (CSI 300) into either consumer related companies (first table) or industrial related companies (second table). We then show the aggregate annual growth rates in sales and liabilities for both of these groups. The data clearly shows stability in the top line growth rate of the consumer related companies and cratering growth among the industrial/investment related companies. Given the required duration of this transition, we think there is a high probability that we see these trends continue and even permeate more broadly into other equity markets in both the emerging and developed worlds. (click to enlarge) Source: Gavekal Capital (click to enlarge) Source: Gavekal Capital So the big question is obviously what all this means from an investment perspective. To our mind the clear takeaway is that investors should be overweight EM and DM consumer, heath care, technology, and high tech manufacturing companies with exposure to China and other emerging markets making a similar transition. These companies stand to benefit from the heightened consumption growth and the “move up the value chain” goal of many emerging market countries in terms of manufacturing. Alternatively, investors would be well suited to underweight the areas of the EM and DM stock markets with direct or indirect exposure to China including energy, materials, utilities and industrial manufacturing with a low gross profit margin (basically commodity and commodity pass through plays). The practical problem of course is that market capitalization weighted and even most smart beta ETFs that invest in EM stocks (think VWO , EEM , or DEM ) typically have high weightings to the exact areas that are most likely to see slowing growth. The same can be said for developed market ETFs such as VT , ACWI , ACWV , SDIV and URTH . The trick is to find vehicles that offer the opportunity to benefit from China’s years-long transition instead of vehicles that are in effect leaning against it. The original posting of this article can be found here . Disclosure: I/we have no positions in any stocks mentioned, and no plans to initiate any positions within the next 72 hours. (More…) I wrote this article myself, and it expresses my own opinions. I am not receiving compensation for it. I have no business relationship with any company whose stock is mentioned in this article. Scalper1 News
Scalper1 News