Scalper1 News


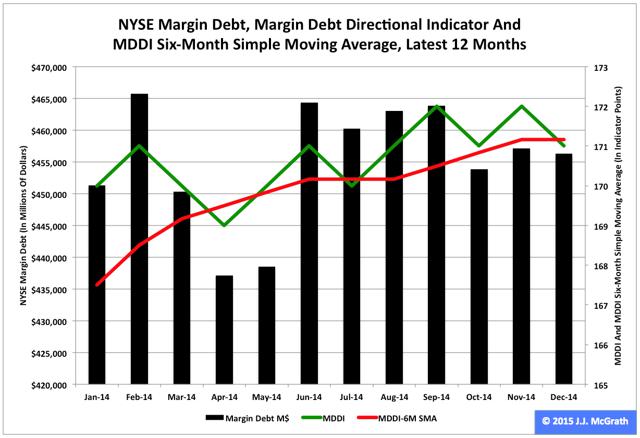
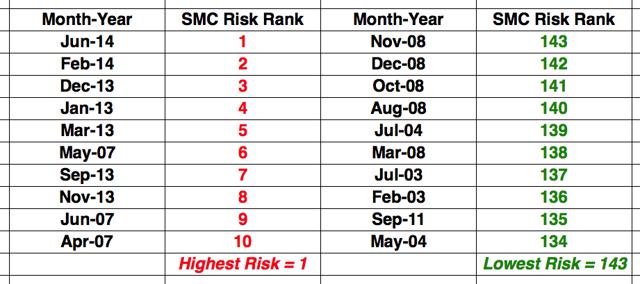
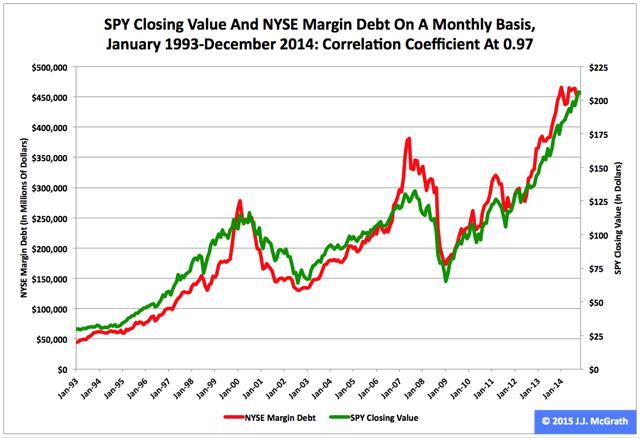
 Summary New York Stock Exchange margin debt slipped slightly to $456.28 billion in December from $457.11 billion in November. On the same basis, the SPDR S&P 500 Trust ETF’s adjusted closing monthly share price also slipped slightly to $205.54 from $206.06. The risk of speculation appeared lower in December than it did in November, but higher than it did in 69.93 percent of all months ranked by my methodology. New York Stock Exchange margin debt and the SPDR S&P 500 Trust ETF (NYSEARCA: SPY ) moved in the same direction in December for the second straight month, as each was down a wee bit. The level of NYSE margin debt relinquished -$823 million, or -0.18 percent, and the share price of SPY surrendered -$0.52, or -0.25 percent. Many equity market participants consider margin debt a long-term indicator of speculation in the stock market because of their tendency to move either higher or lower together. The NYSE has reported monthly data on securities market credit in three discrete series since 2003 and on margin debt itself since 1959. My primary analyses of these three data series focus on two proprietary metrics, the Margin Debt Directional Indicator, or MDDI, and the Securities Market Credit Risk Rank , or SMC Risk Rank, as described in “NYSE Margin Debt As An Indicator Of Long-Term Movements In S&P 500.” Figure 1: MDDI, January 2014-December 2014 (click to enlarge) Source: This chart is based on a proprietary analysis of monthly margin-debt data at NYSE’s online site. NYSE margin debt in December was -$9.44 billion, or -2.03 percent, lower than it was at its all-time high level in February (Figure 1). The anomalous behavior of margin debt in neither falling a great deal nor rising a great deal during the rest of 2014 appears unsustainable, factoring in the U.S. Federal Reserve’s actual announcement of the end of its latest quantitative easing program Oct. 29 and projected announcement of the beginning of its newest interest rate cycle April 29. This anomalous behavior is reflected by the MDDI, which basically is a comparative assessment of NYSE margin debt in the two most recent months of the data series. If the latest value of the MDDI ( MDDI in the above figure) is higher than its six-month simple moving average ( MDDI 6M SMA in the same figure), then I consider the market to be in bullish mode. If the most recent value of the MDDI is lower than its six-month SMA, then I consider the market to be in bearish mode. The MDDI’s December level is 171, which is lower than its November value of 172 and its six-month SMA of 171.17. As a result, I consider the equity market to have switched modes as of Dec. 31, to bearish from bullish. Based on the January performances of the stock market in general and SPY in particular, I anticipate a continuation of this mode for another month (at least). Figure 2: Highest And Lowest Risk Months, Per SMC Risk Rank (click to enlarge) Source: This table is based on proprietary analyses of monthly securities-market-credit data at NYSE’s online site. December is No. 43 among all 143 months evaluated since the January 2003 baseline by my SMC Risk Rank methodology, which carries out a comparative assessment of the data NYSE has reported in three discrete series: Margin Debt , Free Credit Cash Accounts and Credit Balances in Margin Accounts . The dynamic SMC Risk Rank is designed as a measure of equity market risk associated with speculation, ranking each month in the data set on an ongoing basis. At present, June 2014 is No. 1 , February 2014 is No. 2 and December 2013 is No. 3 among all months ranked (Figure 2). November’s SMC Risk Rank of No. 43 means I consider the stock market risk associated with speculation last month was higher than 69.93 percent and lower than 29.73 percent of all other months evaluated by the methodology. A high SMC Risk Rank for a given month indicates the market may be close to a significant peak, and a low SMC Risk Rank for a given month suggests the market may be close to a significant trough. In my interpretation, the term close in this context typically has meant within three to six months . Figure 3: NYSE Margin Debt And SPY, January 1993-December 2014 (click to enlarge) Source: This chart is based on monthly margin debt data at NYSE’s online site and adjusted closing monthly share prices of SPY at Yahoo Finance . Historically, NYSE margin debt and SPY have tended to move together, with an almost perfect positive correlation coefficient of 0.97 between them since the exchange-traded fund began trading in 1993 (Figure 3). I anticipate this close relationship will become increasingly important in the absence of Federal Reserve asset purchases under a QE program. If I were a party to either side of a margin debt transaction, then this is the time when I would start wondering whether more speculation is the wisest way to go. Disclaimer: The opinions expressed herein by the author do not constitute an investment recommendation, and they are unsuitable for employment in the making of investment decisions. The opinions expressed herein address only certain aspects of potential investment in any securities and cannot substitute for comprehensive investment analysis. The opinions expressed herein are based on an incomplete set of information, illustrative in nature, and limited in scope. In addition, the opinions expressed herein reflect the author’s best judgment as of the date of publication, and they are subject to change without notice. Disclosure: The author has no positions in any stocks mentioned, and no plans to initiate any positions within the next 72 hours. (More…) The author wrote this article themselves, and it expresses their own opinions. The author is not receiving compensation for it (other than from Seeking Alpha). The author has no business relationship with any company whose stock is mentioned in this article. Scalper1 News
Scalper1 News