Scalper1 News
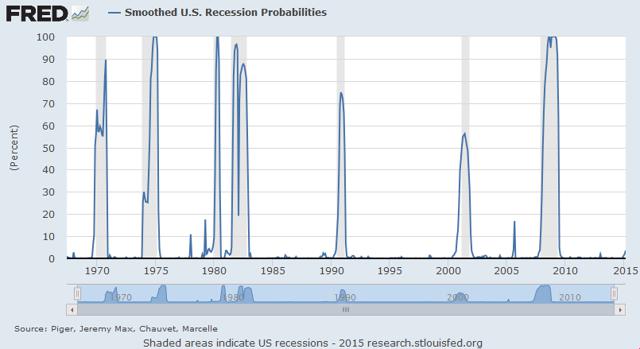
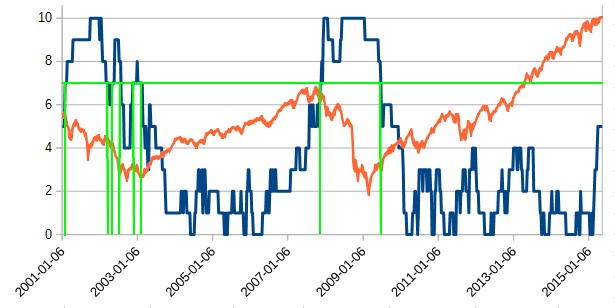
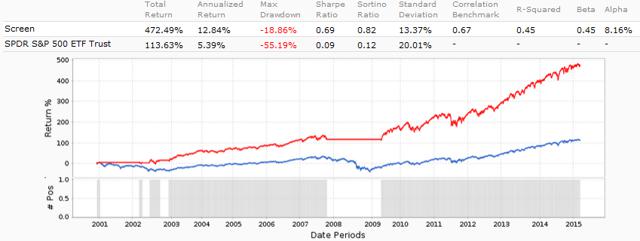 Summary 4 myths about market timing debunked. Why no usual market timing indicator is reliable. What is a systemic indicator, an example and a solution. Market Timing has two points in common with global warming. The first one is that it lets nobody indifferent. Either you believe it, or you discard it. The second one is that some people have a big interest in convincing the public that it’s a children’s tale. Whatever your opinion, there are harmful myths about market timing. Make sure that your savings don’t become victim of one of them. Myth #1: Timing the market means calling the market tops and bottoms. Reality: Timing the market is detecting when the unpredictable becomes more likely. Those who have knowledge, don’t predict. Those who predict, don’t have knowledge. – Lao-Tzu Market timing is not about making predictions, but telling when the ecosystem is favorable to black swans. Myth #2: Timing the market means improving the return Reality: Timing the market aims at protecting the capital. It’s not how much money you make, but how much money you keep. – Robert Kiyosaki The next table shows the difference between holding permanently SPY and following a timing indicator based on short interest (details on it in this article ) between 01/01/2001 and 05/10/2015. Annualized return Max Drawdown Volatility (standard deviation) SPY (buy-and-hold) 5.5% -55.4% 19.7% SPY (timed on short interest) 6.3% -20.2% 10.3% The overhead in return doesn’t look great (0.8% annualized), but the risk reduction is impressive, measured in drawdown and volatility. An economic crisis may go from bad to worse if it causes a personal or professional crisis. Millions of people lost their jobs or businesses in the latest recessions. Dipping in savings for a badly needed amount of money is painful at a 20% drawdown, at a 55% drawdown it may wipe out a retirement plan. Even if you believe that the stock market will always recover, market timing reduces the risk of starting again from scratch. Myth #3: Timing the market means finding a good indicator. Reality: No single indicator is good enough to bet your savings on it. Confidence is what you have before you understand the problem – Woody Allen The United States has crossed 22 recessions since 1900 and 49 since 1785. If we consider that data to test usual market timing indicators are available for about a century (in the best cases), the sample is too small to claim that one timing indicator is better than another. Backtests are useful to compare strategies with several hundreds of trades. With so few data points, they are just a complement to common sense in listing possibly relevant variables. Further conclusions and optimized indicators are “fooled by randomness.” Myth #4: Timing the market means selling stocks and going to cash, bonds, gold (delete as appropriate) Reality: Keeping your stocks with a hedge is safer. We will continue to ignore political and economic forecasts, which are an expensive distraction for many investors and businessmen. – Warren Buffett What you think to be safe might not be. Gold price fell with stocks in 2008. Bonds and stocks may also fall simultaneously. It happened 3 times since 1928 on an annual basis: in 1931 (S&P 500 -43.84%, 10-year Treasuries -2.56%), 1941 (S&P 500 -12.77%, 10-year Treasuries -2.02%), 1969 (S&P 500 -8.24%, 10-year Treasuries -5.01%). It happened more often on a quarterly basis (14 times since 1977, the worst in Q3 1981: S&P 500 -10.29%, Barclay’s aggregate bond index -4.07%). A “bipolar” bear market is quite probable in a rising rate environment. The recent MF Global case is a warning that keeping cash in a trading account is not safe either. Customers’ cash has spent 2 years in the limbos, and the outcome may be worse next time a broker files for bankruptcy. With a diversified portfolio based on valuation or dividend, the safest option is likely to continue with the same strategy, unchanged except adding a hedge to put the portfolio in market-neutral mode . Doing so, no assumption is made about inter-market negative correlations. You just bet that your stock picks as a group will float better than the average, and you continue to cash dividends when there are dividends. A note of caution: this is not true if your portfolio is based on momentum. When a market downturn is likely to happen, momentum stocks are dangerous even in a market-neutral portfolio . Solution: a systemic indicator If you spend more than 13 minutes analyzing economic and market forecasts, you’ve wasted 10 minutes – Peter Lynch The first step to a solution is admitting that no determinist or probabilistic model is accurate to explain human group behaviors. Science applied to group psychology looks very much like pseudo-science. It doesn’t mean that scientific knowledge is useless, but we have to relativize it when used in complex systems with empirical purposes. Readers interested in how approaching complexity may have a look at a research field known as Systems Theory initiated many decades ago by the biologist Ludwig von Bertalanffy . Predicting events in particle physics and casino games is complicated yet possible (at least in terms of probabilities), whereas markets are complex. The difference is that the system cannot be explained starting from its parts. Techniques created in another field have at best a limited validity. One of the best attempts (publicly known) of a systemic timing indicator is the US Recession Probabilities by M. Chauvet and J. Piger: Chart from stlouisfed.org (click to enlarge) It looks good for economists, but I see 3 drawbacks in using this index for investing purposes: It uses only 4 economic variables, none of them taking into account the stock market dynamics and valuation. It gives an illusion of continuity. I think that risk states are discrete with sudden gaps. It is updated only once a month. I created and use another one: MTS10 is a composite market-timing indicator aggregating 10 variables in the 4 main categories of market analysis: sentiment, economy, fundamentals, and technicals. It is focused on a long-term investing horizon, based on research and consensus, without curve-fitting (more details here ). The value of MTS10 is an integer between 0 and 10. The value is updated once a week. The alarm level (7 and above) triggers a market-neutral state for my stock strategies. When the value is below 7, the hedge may be proportional to MTS10 or fixed between 0 and 100% depending on the strategy and the risk currently tolerated. The next chart shows MTS10 since 2001 in blue and the S&P 500 index in red. The green lines are the alarm level (horizontal) and the signals when it is crossed. This chart was plotted last week, with MTS10 at 5 (a 6-year high). The value has changed this week. The risk is not necessarily in proportion with the MTS10 value, but obviously, a higher value means a shorter way to the alarm level. The next charts shows a simulation of holding SPY only when MTS10Scalper1 News
Scalper1 News