Scalper1 News
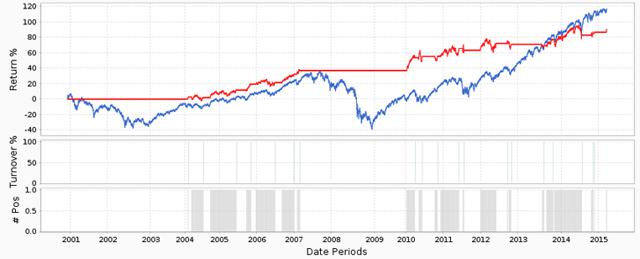
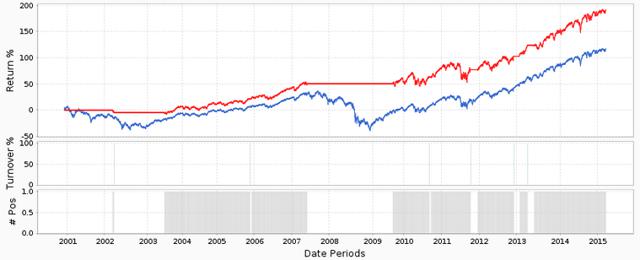
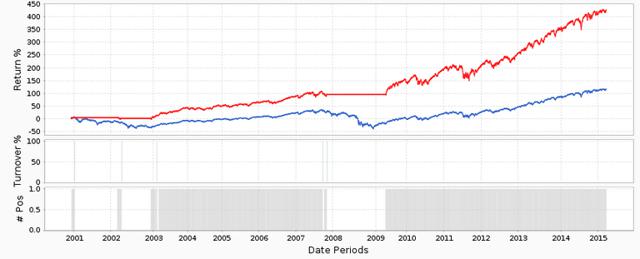
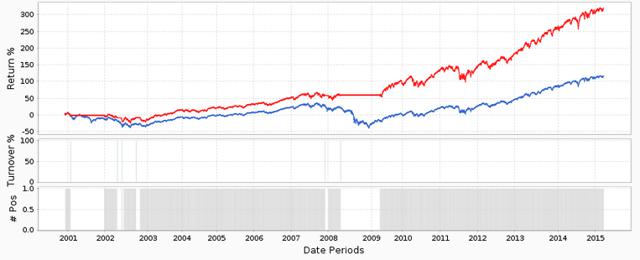 What are Multi Timing Scores. Why they are safer than the usual market-timing indicators. An actionable example. Multi Timing Scores are multi-valued market timing indicators focused on a long-term investing horizon, including the 4 main categories of market analysis: sentiment, economy, fundamentals, technicals. They count bearish signals among a set of elementary indicators based on economic data and S&P 500 companies. Indicators are chosen based on publications and consensus, they are not optimized. Multi Timing Scores gather them and makes the assumption that any of them may be wrong at any time, but not most of them at the same time. By definition, a systemic model is a model able to cope with complexity, which implies coping with uncertainty. Market timing scores take into account uncertainty about signals, and even that an indicator may be irrelevant. This makes them not only systemic, but also more robust than usual optimized indicators. Another characteristic of Multi Timing Scores is that they are multi-valued. The usual market-timing indicators are binary: they tell when you should be in or out of the market. Market conditions are more complex than risk-on / risk-off. Multi Timing Scores do not aim at making predictions, but at telling when the ecosystem is favorable to black swans. They can be considered as risk indicators, but the risk is not necessarily proportional to the score. The best way to understand Multi Timing Scores is to compare them with another score well-known by back-country skiers and mountaineers: the avalanche danger scale. When the level is maximum, it is strongly recommended to stay at home. But even when it is at its lowest value, zero risk does not exist. Fortunately the danger is less acute in investing. Mountains (a tough school of risk management) teach something else: regarding risk, expertise and experience don’t matter. Accident reports show that experts and professionals have more or less the same risk as beginners. Knowledge and routine are an advantage, except when they lead to an excess of confidence. Hence, the importance of having an objective view of risk built on facts and indicators, and always keeping in mind that zero risk does not exist. Market Timing Scores can be used in two ways: Defining an alarm level : the indicator value beyond which the benchmark average return is negative. It can be used to go in cash or take a hedge. The calculation is dependent of a backtest period. Hedging by thresholds. The hedge (for example shorting a stock index) is sized depending on the indicator value. Various tactics are possible, and backtesting may help make a better choice depending on the priority: risk reduction, drawdown duration reduction or return maximization. I will disclose now a simple and actionable version of Multi Timing Score with 4 components: MTS4. It is calculated from 4 elementary values (a,b,c,d) defined as follows: If the unemployment rate is above its value 3 months earlier, then a=1; else a=0. If S&P 500’s current-year EPS estimate is below its value 3 months earlier, then b=1; else b=0. If S&P 500’s 50-day sma is below the 200-day sma, then c=1; else c=0. If the 52-week sma of S&P 500 companies’ average short interest is above the 104-week sma, then d=1; else d=0. MTS4 is simply the sum a+b+c+d. As a consequence, it is an integer between 0 and 4. Readers willing more insights on the choice of elementary indicators can refer to this article and this other one . The charts and table hereafter report simulations of SPY when MTS4 =n+1. The period includes only 2 market cycles (01/01/2001 to 07/22/2015). Most components have been chosen from academic or professional publications studying elementary indicators on longer periods. Data and charts: portfolio123 MTS4=0: (click to enlarge) MTS4Scalper1 News
Scalper1 News