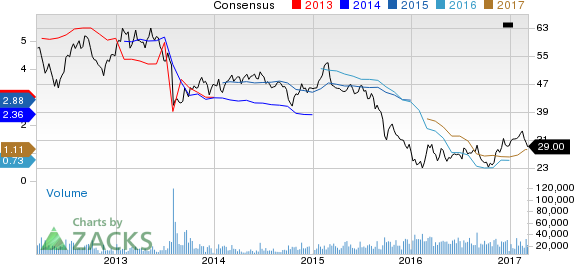
A month has gone by since the last earnings report for Mosaic Company (The) MOS . Shares have lost nearly 11% in that time frame, underperforming the market.
Will the recent negative trend continue leading up to the stock’s next earnings release, or is it due for a breakout? Before we dive into how investors and analysts have reacted as of late, let’s take a quick look at its most recent earnings report in order to get a better handle on the important catalysts.
Mosaic’s Q4 Earnings & Sales Beat Estimates
Mosaic logged earnings (on a reported basis) of $ 0.03 per share in the fourth quarter of 2016, down from $ 0.44 per share recorded a year ago. Earnings, barring one-time items, were $ 0.26 per share that topped the Zacks Consensus Estimate of $ 0.12.
The company’s revenues fell roughly 13.9% year over year to $ 1,862 million in the reported quarter. The figure, however, beat the Zacks Consensus Estimate of $ 1,816 million.
Full-Year 2016
For the full-year 2016, Mosaic reported net income of $ 298 million, or $ 0.85 per share, down from $ 1 billion or $ 2.78 reported in 2015. Net sales in the year stood at $ 7.2 billion, down from $ 8.9 billion recorded in 2015.
Segment Highlights
Revenues from Mosaic’s Phosphates segment declined to $ 896 million in the quarter from the year-ago figure of $ 1 billion owing to lower prices of finished product, partly offset by higher sales volume. The segment’s gross margin shrunk around 30.6% to $ 84 million due to lower average selling prices, partly offset by lower realized ammonia and sulfur costs, higher operating rate and higher proportion of sale of premium products.
Potash division’s sales slipped around 28.8% year over year to $ 407 million in the quarter, hurt by lower average realized prices. Gross margin in the quarter declined 57.4% year over year to $ 66 million due to lower selling prices, partly offset by benefits of cost reduction measures.
Revenues from the International Distribution segment went up around 13.1% year over year to $ 684 million as increased sales volumes more than offset lower average selling prices. Gross margin increased around 55.3% to $ 59 million.
Financials
Mosaic’s cash and cash equivalents amounted to $ 673.1 million as of Dec 31, 2016, down around 47.3% year over year. Long-term debt rose to $ 3,779.3 million as of Dec 31, 2016 from $ 3769.5 million as of Dec 31, 2015. Mosaic’s capital expenditures were $ 209 million in the reported quarter. Operating cash flow was $ 321 million in the quarter, up from $ 302 million in the year-ago quarter.
Outlook
Mosaic expects phosphates sales volumes in the band of 2 million to 2.3 million tons for the first quarter of 2017 versus 2.2 million tons for the same quarter in 2016. Average selling price, FOB plant, is expected to be in the range of $ 315 to $ 335 per ton. The segment gross margin rate is expected to be in the upper single digits.
Potash sales volumes have been forecast in the range of 2.15 million to 2.3 million tons for the first quarter, compared with 1.5 million tons in the prior year quarter. Average selling price, FOB plant, is expected in the band of $ 165 to $ 180 per ton and the gross margin rate is anticipated to be roughly 20%.
Total sales volumes for the International Distribution segment are expected to range from 1.2 to 1.5 million tons for the first quarter of 2016, compared to 1.3 million tons in the prior-year quarter. The segment gross margin is estimated to be around $ 20 per ton.
For 2017, the company expects selling, general and administrative (SG&A) expense to range from $ 295 to $ 310 million.
The effective tax rate is expected to be in the upper single digits.
Capital expenditures are likely to be in the range of $ 800 to $ 900 million, along with equity investments in the Ma’aden Wa’ad Al Shamal Phosphate Company (“MWSPC”) of $ 150 million.
Phosphate sales volume for 2017 is expected to be in the range of 9.5-10.25 million tons. Potash sales volume is expected to range between 8-8.75 million tons, while sales volume in the International Distribution segment is projected between 7-7.5 million tons.
How Have Estimates Been Moving Since Then?
It turns out, fresh estimates flatlined during the past month. There has been one revision higher for the current quarter compared to one lower. In the past month, the consensus estimate has shifted lower by 7.32% due to these changes.
Mosaic Company (The) Price and Consensus
Mosaic Company (The) Price and Consensus | Mosaic Company (The) Quote
VGM Scores
At this time, Mosaic’s stock has a poor Growth Score of ‘F’, however its Momentum is doing a lot better with an ‘A’. Charting a somewhat similar path, the stock was allocated a grade of ‘B’ on the value side, putting it in the second quintile for this investment strategy.
Overall, the stock has an aggregate VGM Score of ‘C’. If you aren’t focused on one strategy, this score is the one you should be interested in.
Our style scores indicate that the stock is more suitable for momentum investors than value investors.
Outlook
The stock has a Zacks Rank #3 (Hold). We are expecting an inline return from the stock in the next few months.
Want the latest recommendations from Zacks Investment Research? Today, you can download 7 Best Stocks for the Next 30 Days. Click to get this free report
Mosaic Company (The) (MOS): Free Stock Analysis Report
The views and opinions expressed herein are the views and opinions of the author and do not necessarily reflect those of Nasdaq, Inc.
Plantations International
