Scalper1 News
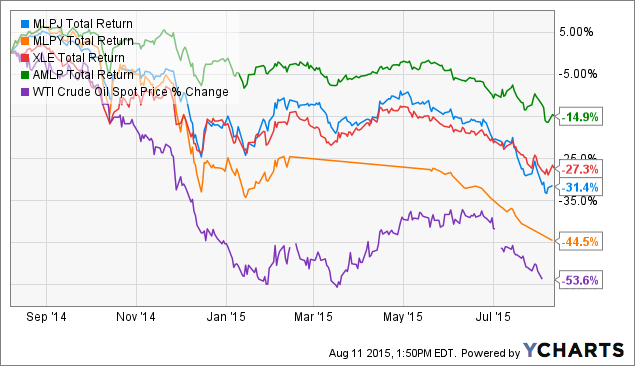
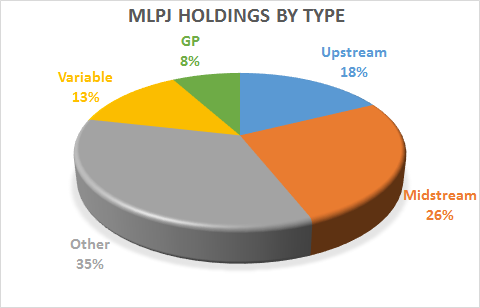
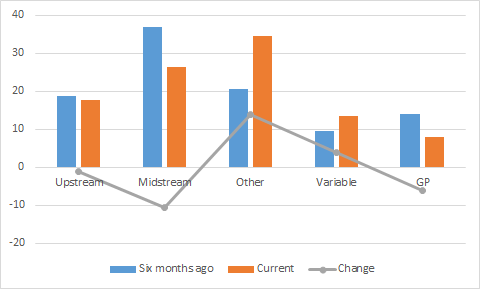
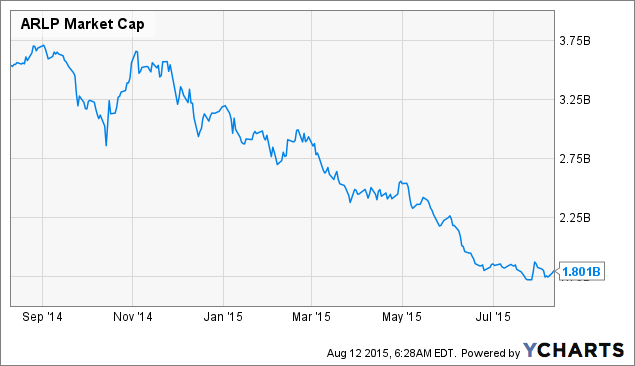
 Summary Recent declines in the energy sector has punished small-cap energy stocks especially hard. MLPJ offers exposure to smaller-cap MLPs, as well as to other energy-related MLPs other than midstream MLPs. How has the MLP profile of MLPJ changed in the past six months? Introduction In a recent article , I provided an update on the Morgan Stanley Cushing MLP High Income Index ETN (NYSEARCA: MLPY ). This high-yielding, diverse MLP ETN was found to have reduced its exposure to upstream MLPs, which can be considered to be the most commodity price-sensitive segment of the MLP space. This change may potentially buffer MLPY against further declines in the price of crude oil. In the comment stream of that article, another user asked if the same phenomenon has occurred for the Global X Junior MLP ETF (NYSEARCA: MLPJ ). Therefore, this article seeks to address this question by analyzing the current holdings of MLPJ to determine whether its MLP profile has changed in the past six months. Moreover, this article describes the inclusion and weighting methodology for MLPJ, something that I did not cover in my previous article on MLPJ. MLPJ methodology MLPJ tracks the performance of the Solactive Junior MLP Compositive Index, which “is intended to give investors a means of tracking the overall performance of the small-capitalization segment of the United States master limited partnerships [MLP] asset class.” The inception of the ETF was January 14, 2013. Information for the methodology for MLPJ can be found on the Solactive website . The composition of the index is adjusted twice a year on the last business day of March and September. Therefore, the index has been adjusted only once since my last article on MLPJ. To be included in the index, an MLP must be focused on the “transportation, storage, processing, holding, refining, marketing, exploration, production, and mining with focus of natural resources”, and have a market cap of between $250M and $2.5B. It also must have an average daily trading volume of at least $500K in the last three months and a average monthly trading volume of at least 75K in each of the last six months. The 30-largest MLPs from this pool are then selected. The 30 MLPs chosen are then weighted according to market capitalization. The five-largest of these 30 have a maximum weighting capped at 9%, while the remainder are capped at 4.75%. The excess weight is allocated proportionally to all Index Components whose Percentage Weight is not capped. In summary, MLPJ is essentially a market-cap weighted index of the 30 largest energy-related MLPs under $2.5B. Recent performance The recent performance of MLPJ has not been pretty. Small-cap energy stocks were hit especially hard as investors fretted over the financial future of such firms. The following chart shows the 1-year total return performance of MLPJ and MLPY, as well as the benchmarks for the U.S. energy sector (NYSEARCA: XLE ) and the midstream MLP space (NYSEARCA: AMLP ). MLPJ Total Return Price data by YCharts The graph above shows that MLPJ’s performance (-31.4%) has been comparable to XLE (-27.3%) over the past twelve months. However, it has underperformed the midstream MLP ETF AMLP (-14.9%), while outperforming MLPY* (-44.5%). (*Note that the total return performance of MLPY, an ETN, may not be comparable to those of the other funds, which are ETFs, due to differences in tax treatment). Composition The constituents of MLPJ are given in the table below. Also shown is the % assets, ttm yield, market cap and type of each constituent . Note that as an ETN, the holdings of MLPJ are not publicly available on a daily basis. The % assets are obtained from the company while the ttm yield and market cap are obtained from Morningstar . In categorizing the type of company, I have used the classification types in the CBRE Clarion Securities MLP Master List website, which considers these following MLP or MLP-related classes: [i] traditionally structured midstream MLPs, [ii] upstream MLPs, [iii] traditionally structured other MLPs (“other”), [iv] variable distribution MLPs (“variable”), [v] MLP GP holding companies (“GP”), [vi] other publicly-traded companies that own GP interest in an MLP (“diverse”), and [vii] other MLP-related securities. Name Ticker Assets / % Yield / % Cap / B Type NORTHERN TIER ENERGY LP (NYSE: NTI ) 8.76 11.59 2.50 Variable CHENIERE ENERGY PARTNERS (NYSEMKT: CQP ) 7.36 5.41 10.50 Other ANTERO MIDSTREAM PARTNERS (NYSE: AM ) 5.92 2.06 3.40 Midstream FERRELLGAS PARTNERS-LP (NYSE: FGP ) 5.80 9.66 1.90 Other HOLLY ENERGY PARTNERS LP (NYSE: HEP ) 5.72 7.38 1.70 Other ALLIANCE RESOURCE PARTNER (NASDAQ: ARLP ) 5.70 10.93 1.80 Other NUSTAR GP HOLDINGS LLC (NYSE: NSH ) 5.65 6.78 1.40 GP EXTERRAN PARTNERS LP (NASDAQ: EXLP ) 4.29 11.02 1.20 Other MARTIN MIDSTREAM PARTNERS (NASDAQ: MMLP ) 4.25 11.48 1.00 Midstream SUMMIT MIDSTREAM PARTNERS (NYSE: SMLP ) 4.15 9.15 1.40 Midstream VALERO ENERGY PARTNERS LP (NYSE: VLP ) 4.05 2.30 2.80 Midstream VANGUARD NATURAL RESOURCE (NASDAQ: VNR ) 3.85 21.22 0.78 Upstream BREITBURN ENERGY PARTNERS (NASDAQ: BBEP ) 3.71 36.35 0.65 Upstream GLOBAL PARTNERS LP (NYSE: GLP ) 3.64 8.52 1.10 Other MEMORIAL PRODUCTION PARTN (NASDAQ: MEMP ) 3.57 29.18 0.61 Upstream ROSE ROCK MIDSTREAM LP (NYSE: RRMS ) 3.46 6.64 1.30 Midstream LEGACY RESERVES LP (NASDAQ: LGCY ) 2.71 24.84 0.55 Upstream TRANSMONTAIGNE PARTNERS LP (NYSE: TLP ) 2.40 8.21 0.53 Midstream EV ENERGY PARTNERS LP (NASDAQ: EVEP ) 2.40 24.77 0.46 Upstream CRESTWOOD EQUITY PARTNERS (NYSE: CEQP ) 2.37 15.49 0.66 GP DORCHESTER MINERALS LP (NASDAQ: DMLP ) 2.22 9.44 0.46 Variable WESTERN REFINING LOGISTIC (NYSE: WNRL ) 2.14 2.56 1.10 Midstream ALON USA PARTNERS LP (NYSE: ALDW ) 1.69 9.92 1.60 Variable ATLAS RESOURCE PARTNERS LP (NYSE: ARP ) 1.40 49.18 0.33 Upstream NATURAL RESOURCE PARTNERS (NYSE: NRP ) 1.24 32.47 0.34 Other FORESIGHT ENERGY LP (NYSE: FELP ) 0.81 13.88 1.00 Other VIPER ENERGY PARTNERS LP (NASDAQ: VNOM ) 0.74 4.93 1.10 Variable We can see from the table above that in addition to midstream MLPs (26%), MLPJ also contains a significant proportion of “other” (35%) MLPs. According to CBRE, “other” MLPs include all MLPs that are not midstream MLPs, but are structured like midstream MLPs (with a minimum quarterly distribution). These include coal, compression, shipping, oilfield services, wholesale distribution, and everything else. (Note: other authorities classify wholesale distribution as midstream). Examples of “other” MLPs in MLPJ include Ferrellgas Partners, a supplier of propane, and Alliance Resource Partners, a diversified coal producer and marketer. The allocations of MLPY are depicted in the chart below. How does this composition compare to six months ago ? The following chart shows the former, current and changes in the six categories of MLPs in MLPJ from six months ago to now. We can see from the chart above that the proportion of midstream holdings in MLPJ has decreased from 37% to 26%. Unlike MLPY , however, MLPJ has not seen a massive decline in upstream assets. The percentage of holdings in upstream MLPs decreased only slightly, from 19% six months ago to 18% today. The reason for this is that MLPJ, unlike MLPY, does not eliminate dividend cutters from its index. This is probably the reason why the upstream MLPs such as BBEP, which slashed its dividend in January of this year, survived the March rebalancing. Meanwhile, the upstream MLP ARP may yet see itself removed from the index if its market cap falls below $250M (its current market cap is $332M). Other notable changes the composition include an increase in the number of “other” MLPs, from 21% to 35%. An example of an “other” MLP to be added is the coal-based ARLP, which was added to the index as its market cap fell below $2.5B earlier this year. ARLP Market Cap data by YCharts Distribution Since my last article, MLPJ has paid out 3 more distributions. Unlike MLPY, however, which is an ETN and hence passes through the income received from its assets directly to unitholders, MLPJ is an ETF, which allows it to control its distributions. The last two quarterly distributions were increased by 1 cent each, representing increases of 4%. However, as some of this income may be return-of-capital, it is difficult to anticipate the sustainibility of the dividend going forward without a comprehensive analysis of the dividend future of each individual company. Risks MLPJ contains companies that are smaller in size compared to those found in the large-cap funds AMLP or AMJ. Moreover, energy-related MLPs are, to various extents, acutely sensitive to commodity prices, and the 8.80% distribution may or may not be sustainable. Additionally, there is a significant risk of capital loss if energy prices slide further. Finally, MLPJ’s expense ratio is 0.75%, which slightly lower than that for AMLP or JPMorgan Alerian MLP Index ETN (NYSEARCA: AMJ ) (0.85%). Conclusion This article was intended to provide an update on the MLP profile of MLPJ, a small-cap MLP fund, as requested by a reader. MLPJ’s midstream exposure was decreased by 10% (absolute percentage) while its “other” MLP exposure was increased by 14% (absolute percentage). Furthermore, and unlike MLPY (which has rules to eliminate dividend cutters from its index), MLPJ has not dramatically reduced its exposure to upstream MLP companies, which still remains at a robust 18%. The upstream MLP companies still remaining in MLPJ include VNR (3.85% of assets), BBEP (3.71%), MEMP (3.57%), LGCY (2.71%), EVEP (2.40%) and ARP (1.40%). Consequently, investors uncomfortable with owning upstream MLPs in any capacity should obviously avoid MLPJ due to its 18% exposure to upstream companies. On the other hand, more risk-seeking investors anticipating a rebound in oil prices actually favor MLPJ due to its 18% upstream MLP exposure. As upstream MLPs have fallen among the hardest as crude oil prices slid, it is not unreasonable to expect their share prices to snap back the quickest if oil prices do rebound. As there is no MLP fund dedicated exclusively to upstream MLPs, MLPJ may be a decent choice for investors who want exposure to upstream MLPs but are uncomfortable with picking individual companies. Disclosure: I/we have no positions in any stocks mentioned, and no plans to initiate any positions within the next 72 hours. (More…) I wrote this article myself, and it expresses my own opinions. I am not receiving compensation for it (other than from Seeking Alpha). I have no business relationship with any company whose stock is mentioned in this article. Scalper1 News
Scalper1 News