Scalper1 News
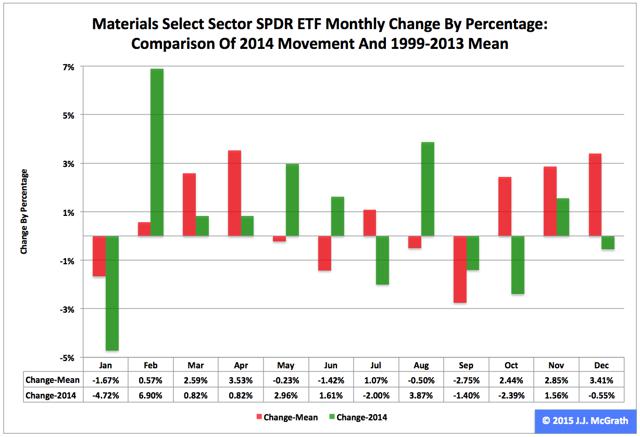
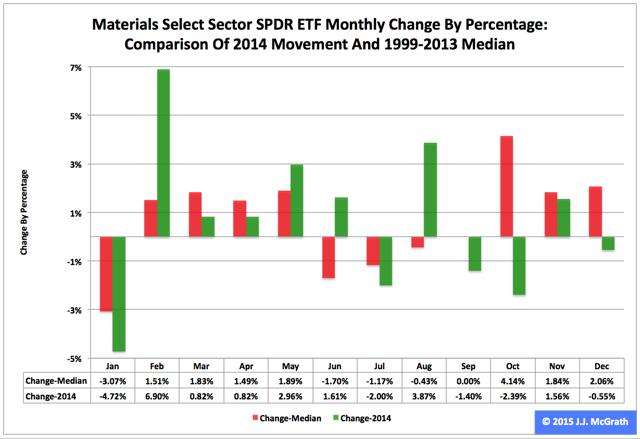
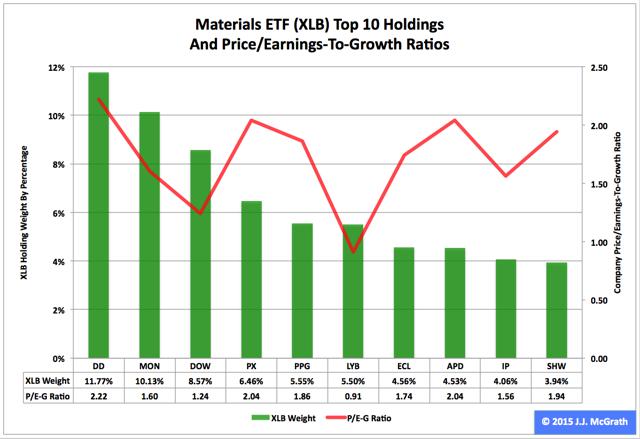 Summary The Materials exchange-traded fund finished eighth by return among the nine Select Sector SPDRs in 2014. The ETF was a winner in the first and second quarters, flattish in the third and a loser in the fourth. Seasonality analysis indicates its downward trajectory could continue in the first quarter. The Materials Select Sector SPDR ETF (NYSEARCA: XLB ) in 2014 ranked No. 8 by return among the Select Sector SPDRs that section the S&P 500 into nine subdivisions. On an adjusted closing daily share-price basis, XLB progressed to $48.58 from $45.33, a yield of $3.25, or 7.17 percent. Accordingly, it lagged its sibling, the Utilities Select Sector SPDR ETF (NYSEARCA: XLU ) and parent proxy, the SPDR S&P 500 Trust ETF (NYSEARCA: SPY ) by -21.57 and -6.29 percentage points, in that order. (XLB closed at $47.19 Wednesday.) XLB also ranked No. 8 among the sector SPDRs in the fourth quarter, when it behaved worse than XLU and SPY by -14.60 and -6.32 percentage points, respectively. And XLB ranked No. 6 among the sector SPDRs in December, when it performed worse than XLU and SPY by -4.13 and -0.30 percentage points, in that order. Figure 1: XLB Monthly Change, 2014 Vs. 1999-2013 Mean (click to enlarge) Source: This J.J.’s Risky Business chart is based on analyses of adjusted closing monthly share prices at Yahoo Finance . XLB behaved worse in 2014 as it did during its initial 15 full years of existence based on the monthly means calculated by employing data associated with that historical time frame (Figure 1). The same data set shows the average year’s weakest quarter was the third, with an absolutely large negative return, and its strongest quarter was the fourth, with an absolutely larger positive return. Inconsistent with this pattern last year, the ETF actually had a loss in Q4. Figure 2: XLB Monthly Change, 2014 Versus 1999-2013 Median (click to enlarge) Source: This J.J.’s Risky Business chart is based on analyses of adjusted closing monthly share prices at Yahoo Finance. XLB performed a little worse in 2014 than it did during its initial 15 full years of existence based on the monthly medians calculated by using data associated with that historical time frame (Figure 2). The same data set shows the average year’s weakest quarter was the third, with an absolutely large negative return, and its strongest quarter was the fourth, with an absolutely larger positive return. It also shows there is no historical statistical tendency for the ETF to explode in Q1. Figure 3: XLB’s Top 10 Holdings and P/E-G Ratios, Jan. 14 (click to enlarge) Note: The XLB holding-weight-by-percentage scale is on the left (green), and the company price/earnings-to-growth ratio scale is on the right (red). Source: This J.J.’s Risky Business chart is based on data at the XLB microsite and Yahoo Finance (both current as of Jan. 14). LyondellBasell Industries NV (NYSE: LYB ) aside, XLB’s top 10 holdings appear to range between fairly valued and overvalued (Figure 3). And these kinds of valuations seem unlikely to function as tailwinds for the ETF this quarter, even though the numbers on the S&P 500 materials sector reported by S&P Senior Index Analyst Howard Silverblatt Dec. 31 indicated the sector’s valuation is not superstretched, with its P/E-G ratio at 1.26. However, I suspect XLB will continue to be a laggard among the Select Sector SPDRs in Q1, mostly because of the bias divergence in monetary policy at major central banks around the world. On the one hand, the U.S. Federal Reserve is oriented toward tightening; on the other hand, the Bank of Japan, European Central Bank and People’s Bank of China are oriented toward loosening. This bias divergence has had important effects on currency-exchange rates, such as the one centered on the euro and U.S. dollar pair: The EUR/USD cross dipped from as high as $1.3992 May 8 to as low as $1.1753 Jan. 8, a drop of -$0.2239, or -16.00 percent. This change in EUR/USD and similar moves in other currency pairs could pressure earnings of U.S. companies in sectors with substantial international businesses. It is noteworthy the Fed announced the conclusion of asset purchases under its latest quantitative-easing program Oct. 29 and may announce the beginning of interest-rate hikes April 29. Its ending of purchases under its first two formal QE programs this century is associated with a correction and a bear market in large-capitalization equities, as evidenced by SPY’s falling -17.19 percent and -21.69 percent in 2010 and 2011, respectively. If one were to argue that this time is different, then I would have to wonder: Why? Disclaimer: The opinions expressed herein by the author do not constitute an investment recommendation, and they are unsuitable for employment in the making of investment decisions. The opinions expressed herein address only certain aspects of potential investment in any securities and cannot substitute for comprehensive investment analysis. The opinions expressed herein are based on an incomplete set of information, illustrative in nature, and limited in scope. In addition, the opinions expressed herein reflect the author’s best judgment as of the date of publication, and they are subject to change without notice. Scalper1 News
Scalper1 News