Scalper1 News


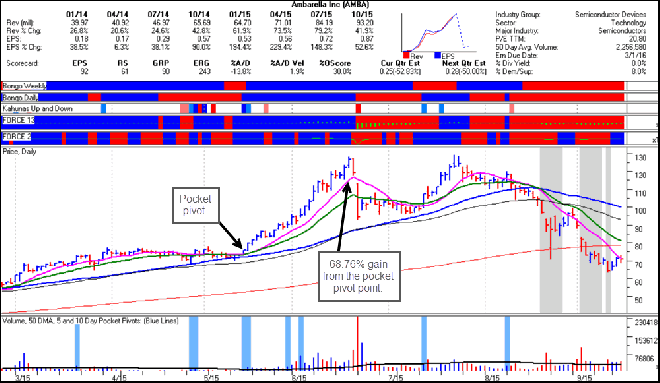
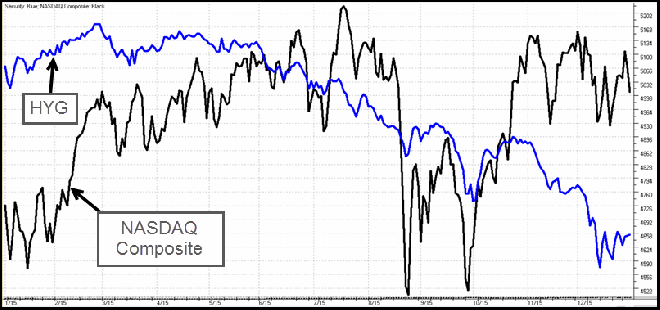
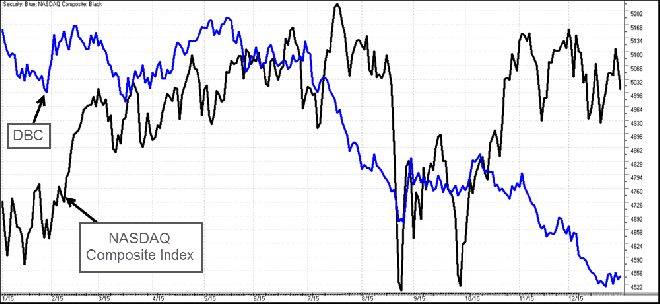
 2015 has been one of the most challenging, trendless yet choppy years seen in decades. As a consequence, hedge funds have had one of their worst performing years, and some media souces have cited 2015 as the “most difficult” market in 78 years. Even the performance-tracked trend-following wizards, a collection of top traders who have been interviewed in “Market Wizard” type books and who have been running hedge funds for at least several years if not longer, have once again collectively lost money as of November 30, 2015. They will post final results in early January 2016. Indeed, each year seems worse than the last so we have had to create new strategies to keep profits alive. Finding early entry points within bases rather than buying into obvious O’Neil-style base breakouts through the use of pocket pivots and “voodoo” pullbacks within base structures has been critical. Once an advantage is gained by implementing some of our early-entry buying methods, selling into strength in context with a stock’s chart and keeping stops extra tight such as we illustrated in some of our weekly pocket pivot/buyable gap up reports has been essential to making any kind of progress in this market. By doing so, a gain of 10% or more can easily offset a few small losses of 1-2%. That said, earlier this year, profits came more easily. Profits in individual stocks well beyond 20-25% were achievable. In the first half of the year, a number of high quality names (SUPN, AMBA, SKX, etc) hit our screens resulting in profitable summary reports such as the one we emailed in June: http://www.virtueofselfishinvesting.com/reports/view/market-lab-report-stocktalk-sunday-edition-6-14-15 Ambarella (AMBA) illustrates the treacherous action that often characterized even the best-performing names. In mid-May, we issued a pocket pivot alert for the stock as it was still in its base, and this led to a sizzling 68.7%, five-week upside move to the peak in mid-June. However, if one had held the stock two days too long after the peak day, over half of those rapid upside gains dissolved instantaneously. The key sell signal came on 6/19, one day after the stock peaked on 6/18. Downside volume was the highest in the history of the stock. Further, the stock was clearly getting ahead of itself such that one could sell at least half of one’s position on 6/19. It closed at 119.35. Then the next trading day, on 6/22, the stock gapped lower, opening at 112.61, which would be the “sell all” signal if you still held any shares. The stock then moved a lot lower that day, closing at 94.36. But since June, profiting in stocks has been a major challenge. In a nutshell, the pickings have been slim. The fall in junk bonds accelerated in June of this year which put pressure on the stock market much as it did in 2007-2008 before the big crash. As we mentioned, when junk bonds plummet, the stock market corrects along with junk bonds. The correlation is quite high, as can be seen in the comparison chart of the iShares High-Yield Bond Fund (HYG) and the NASDAQ Composite Index, below. Meanwhile, oil and other commodities continue their slide which also pressures stock markets, as can be seen in the comparison chart of the Powershares Commodity Index ETF (DBC), below. Quantitative easing (QE) has been unable to resuscitate global demand as a growing number of countries sink into recession. Despite these troubling times, governments continue to raise taxes which is often the final nail in the economic coffin. In fact, major world governments with the exception of China are doing everything they can to extract as much tax as possible from their citizens. For example, the US has pressured the Swiss government to hand over all its private records of those who keep valuables in Swiss warehouses. The Chinese, for example, buy works of art worth millions of dollars, then store them in these warehouses. They do it to move money out of China as the Chinese government prohibits any Chinese citizen from moving more than the equivalent of roughly $50,000 out of the country. Crippling their respective economies by attempting to extract as much tax as possible, governments delay any true global economic recovery. The silver lining is that the Federal Reserve has hiked rates for the first time in a decade, thus the U.S. markets may no longer be on the QE bandwagon. If we assume that the Fed’s dot plot proves somewhat accurate, they should hike rates a few times in 2016. This may restore some normality to stock markets. That said, the repercussions for low grade loans may be dire. Many such loans have been made due to historically low rates as individuals, businesses, and governments have levered up again as they did in 2007-2008. This in itself is a potential bubble waiting to burst. The pin that pops the bubble could be an additional rate hike or two. The best cure would likely be a proper bear market or crash that is long overdue. Perhaps this would be the equivalent of hitting the reset button. Since the dot-com bubble burst in the early 2000s, stock markets have behaved differently. Base breakouts and CAN SLIM type names no longer worked well compared to the 1980s and 1990s. Thus, the pocket pivot and buyable gap up concepts were born in 2004 then put to the test in 2005. Then when QE market manipulations began in late 2008, markets behaved in a manner that was even more at odds with many decades of market history. Most tried-and-true indicators stopped working. Thus investors lost money by trying to hang onto market history. The latest challenge has been 2015 which has been choppy and trendless. Much as the pocket pivot and buyable gap up strategies were born from the post-dot-com bubble market wherein most base breakouts stopped working, the VIX Volatility Model was born from this year’s trendless market. The model especially enjoys volatility, trendless markets such as the one in 2015, as well as low volatile, uptrending markets. Testing has shown profits far exceed the small losses. The fail-safes make a big difference to the strategy’s risk/reward profile, so the beta phase has been worthwhile. We thank you for your patience. As one can see from the model’s last few signals, losses are typically contained to within 0-1.5% while gains are typically 3% or more as the current signal sits on a 8.2% gain using 2x ETF UVXY. For record keeping purposes, UVXY will be used as the benchmark as prior testing shows this to be the optimum instrument on BUY signals which over any given cycle tends to well outperform in back tests. So as for the New Year, stay tuned for new developments at home and abroad which may be fraught with shock and surprise as 2016 may well prove to be one of the more volatile years on record given that central banks around the world continue to paint themselves into a corner. Volatile markets such as 2000-2002, 2008, and 2011 often bring great market-timing profit opportunities. VoSI members should not let a difficult market year as we saw in 2015 cause them to freeze up. It is critical that investors maintain optimistic vigilance, since the greatest market opportunities tend to occur when we least expect them. In our first book, “Trade Like an O’Neil Disciple,” we discussed how bleak the market was looking on October 23, 1999. At that time, William J. O’Neil, for whom we were both running money back then, declared that “This market is through.” Four days later the market followed-through in an historic parabolic rally that carried into the peak of March 2000. It was literally a life-changing event for both of us as our double-digit performance up until October 1999 ballooned to over +500 to +1,000% in just a couple of months. The lesson here is that even the greatest traders on the planet can’t see the future and can’t be aware of when the market’s most fantastically profitable and historic opportunities will present themselves ahead of time. They can only move in sync and in tune with the available real-time market evidence and thereby put themselves in the position of “getting lucky.” Market pundits and commentators make a living writing and prognosticating about what a new investment year will bring, but ultimately it is merely blather and bloviation.  Had we relied on some sort of macro-prediction or “outlook” for the market in October of 1999, we might have missed the follow-through day on October 27th and the start of one of the most amazing year-end stock market runs in history. Thus our message for 2016 is simple: Predictions are useless. Keep an open mind and let the market tell you what it is doing in real-time, and be prepared to put yourself in the position of being able to “get lucky.” Dr. Chris Kacher & Gil Morales Scalper1 News
Scalper1 News