Scalper1 News
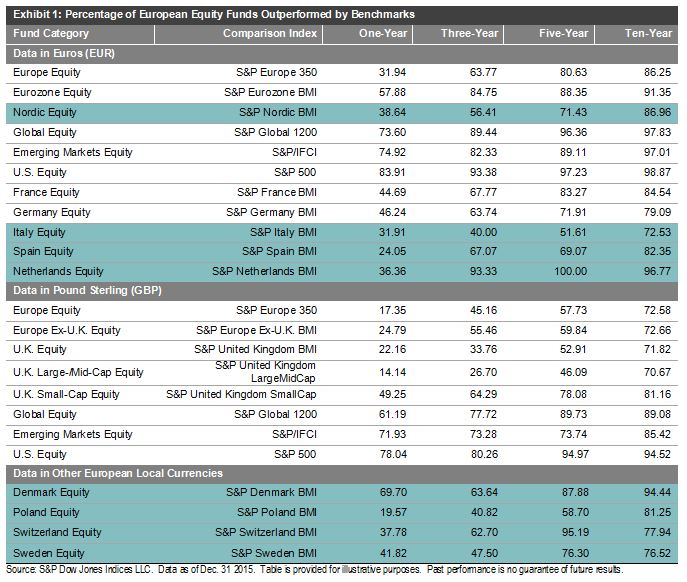
 By Daniel Ung Every six months, S&P Dow Jones Indices publishes the S&P Indices Versus Active (SPIVA®) Europe Scorecard, which seeks to compare the performance of actively managed equity funds across different categories, and in the SPIVA Europe Year-End 2015 Scorecard , we expanded it to cover more individual countries and regions. Among the new additions are Italy, the Netherlands, Poland, Spain, Switzerland, and the Nordic region, with specific data for Denmark and Sweden. This is also the first year-end report in which 10-year data is published for Europe. To access the full report, please click here and for the video summarizing the major findings of the report, please click here . Global equity markets, as measured by the S&P Global 1200 , rose 10.4% over the past one-year period, as measured in euros, which could largely be attributed to the European Central Bank’s quantitative easing program. However, this apparently positive performance masked the heightened volatility that the equity markets experienced over the course of the year, which was a consequence of anemic Chinese growth, as well as the collapse in energy and commodity prices. Compared to the S&P Europe 350 , while 68.1% of active managers outperformed the benchmark over the short run, they underperformed the benchmark over longer time horizons. 63.8% of active managers underperformed the benchmark by the end of the three-year period, 80.6% in the five-year period, and 86.3% over the 10-year period. Exhibit 1 shows the new categories highlighted in blue. As for the global, emerging market, and U.S. equity categories, actively managed funds – in both euro and pound sterling – underperformed substantially in the short term (one-year category) and in the long run (10-year category). For instance, 61.2% of global equity funds underperformed their benchmark over a one-year period, and 89.08% of funds underperformed the benchmark over a 10-year period. Disclosure: © S&P Dow Jones Indices LLC 2015. Indexology® is a trademark of S&P Dow Jones Indices LLC (SPDJI). S&P® is a trademark of Standard & Poor’s Financial Services LLC and Dow Jones® is a trademark of Dow Jones Trademark Holdings LLC, and those marks have been licensed to S&P DJI. This material is reproduced with the prior written consent of S&P DJI. For more information on S&P DJI and to see our full disclaimer, visit www.spdji.com/terms-of-use . Scalper1 News
Scalper1 News