Scalper1 News
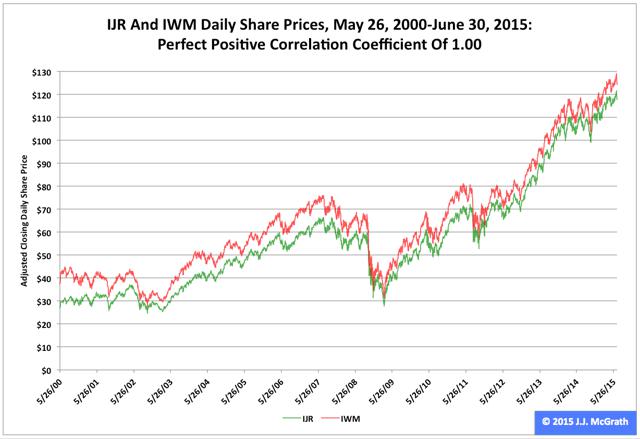
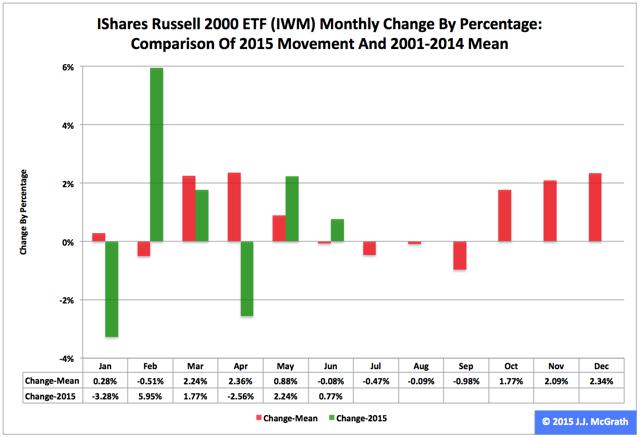
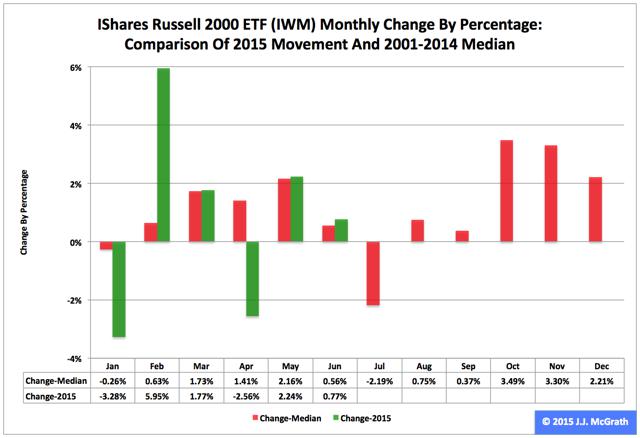 Summary The iShares Russell 2000 ETF behaved better than the iShares Core S&P Small-Cap ETF did in the first half of the year. The former fund also performed better than the latter fund did in the second quarter. However, the converse was the case in June. The iShares Russell 2000 ETF (NYSEARCA: IWM ) and the iShares Core S&P Small-Cap ETF (NYSEARCA: IJR ) both recorded positive returns in the first half, Q2 and June based on their respective adjusted closing daily share prices, which is saying something in the current equity-market environment. IWM led IJR by 66 basis points in the first half as it ascended to $124.84 from $119.26, a climb of $5.58, or 4.68 percent. And IWM outdistanced IJR by 21 basis points in Q2 as it expanded to $124.84 from $124.37, a gain of 47 cents, or 0.38 percent. But the two ETFs switched roles in June, with IWM lagging IJR by -29 basis points as it grew to $124.84 from $123.89, an increase of 95 cents, or 0.77 percent. Comparisons of changes by percentages in IWM, IJR, the SPDR S&P MidCap 400 ETF (NYSEARCA: MDY ), the SPDR S&P 500 ETF (NYSEARCA: SPY ) and PowerShares QQQ (NASDAQ: QQQ ) during the first half, over Q2 and in June can be found in charts published in “SPY’s 2015 2nd-Quarter Performance And Seasonality.” Figure 1: History Of IJR And IWM Daily Share Prices (click to enlarge) Source: This J.J.’s Risky Business chart is based on analyses of adjusted closing daily share prices at Yahoo Finance . Since IWM and IJR were launched May 26, 2000, there has been a perfect positive correlation coefficient between the adjusted closing daily share prices of the two ETFs, which is one reason I believe each is an excellent proxy for the small-capitalization segment of the U.S. equity market (Figure 1). Accordingly, I analyze data associated with both funds in the context of my Risky Business Daily Market Seismometer , as mentioned in “Assessing IWM With The Aid Of The U.S. Economic Index.” Of course, the ETFs are not identical but similar, as evidenced by their behaviors between their shared launch date and June 30, when IJR handily outpaced IWM by 102.54 percentage points. In this period, the fund based on the S&P 600 index rose 333.86 percent and the fund based on the Russell 2000 index rose 231.32 percent. As result, I think the ETFs’ differences are relatively trivial in terms of analysis and absolutely nontrivial in terms of their employment in an investing or trading portfolio. Overvaluation appears to be one characteristic currently shared by both funds’ underlying indexes. I note the Russell 2000’s price-to-earnings ratio on a trailing 12-month basis was calculated as 78.00 July 2, according to Birinyi Associates data published by The Wall Street Journal , and I point out the S&P 600’s valuation was discussed in “IJR’s 2015 2nd-Quarter Performance And Seasonality” here at Seeking Alpha. Figure 2: IWM Monthly Change, 2015 Vs. 2001-2014 Mean (click to enlarge) Source: This J.J.’s Risky Business chart is based on analyses of adjusted closing monthly share prices at Yahoo Finance . IWM behaved a little worse in the first half of this year than it did during the comparable periods in its initial 14 full years of existence based on the monthly means calculated by employing data associated with that historical time frame (Figure 2). The same data set shows the average year’s weakest quarter was the third, with an absolutely large negative return, and its strongest quarter was the fourth, with an absolutely large positive return. Figure 3: IWM Monthly Change, 2015 Vs. 2001-2014 Median (click to enlarge) Source: This J.J.’s Risky Business chart is based on analyses of adjusted closing monthly share prices at Yahoo Finance. IWM performed a lot worse in the first half of this year than it did during the comparable periods in its initial 14 full years of existence based on the monthly means calculated by using data associated with that historical time frame (Figure 3). The same data set shows the average year’s weakest quarter was the third, with an absolutely large negative return, and its strongest quarter was the fourth, with an absolutely large positive return. Disclaimer: The opinions expressed herein by the author do not constitute an investment recommendation, and they are unsuitable for employment in the making of investment decisions. The opinions expressed herein address only certain aspects of potential investment in any securities and cannot substitute for comprehensive investment analysis. The opinions expressed herein are based on an incomplete set of information, illustrative in nature, and limited in scope. In addition, the opinions expressed herein reflect the author’s best judgment as of the date of publication, and they are subject to change without notice. Disclosure: I/we have no positions in any stocks mentioned, and no plans to initiate any positions within the next 72 hours. (More…) I wrote this article myself, and it expresses my own opinions. I am not receiving compensation for it (other than from Seeking Alpha). I have no business relationship with any company whose stock is mentioned in this article. Scalper1 News
Scalper1 News