Scalper1 News


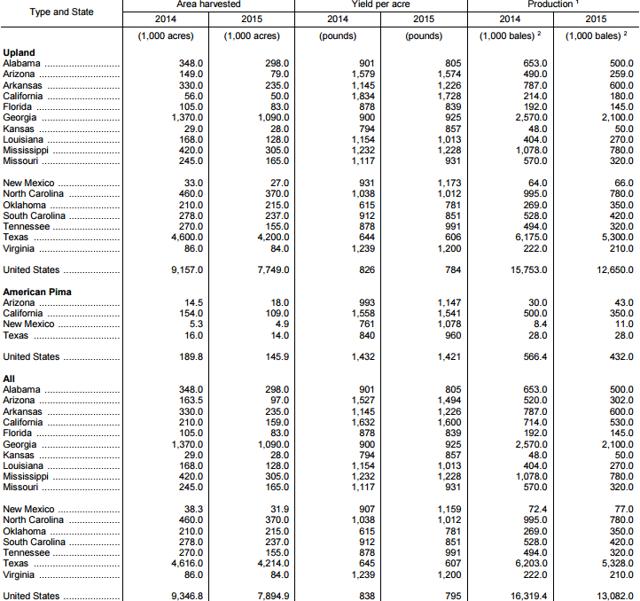
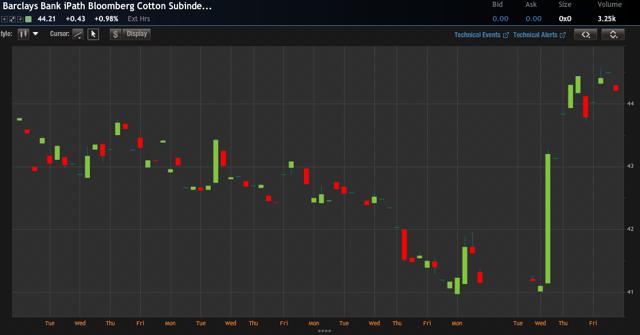
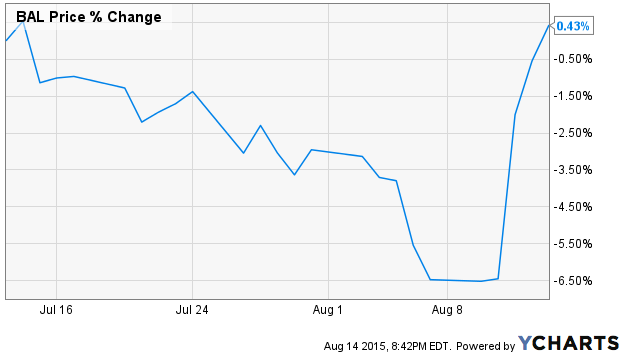
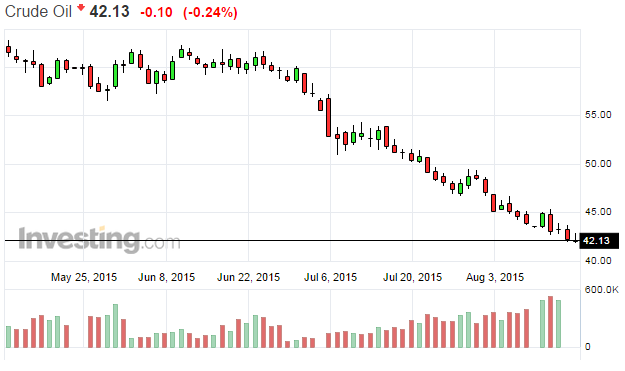
 Summary The most recent report shows a 20% decline in production. Crude oil remains near 6 year lows. Global stocks are shrinking, but not by much. October is peak harvesting season for cotton. This article will center around the recent United States Department of Agriculture (USDA) projections on cotton and the subsequent affect that could have on the iPath Dow Jones-UBS Cotton Total Return Sub-Index ETN (NYSEARCA: BAL ). During our last article on BAL, which you can read here , we discussed how oil and cotton shared a correlation. We will revisit that discussion and end with an analysis of current conditions. USDA For the full context of what we are going to discuss in this article, here are the links to the USDA’s August crop production and world markets and trade circulars for cotton. I highly recommend viewing the links as we will not cover the global supply and demand factors in this article (except for a summary in the conclusion). (click to enlarge) Chart obtained from the USDA. The above chart explains the recent increase in cotton prices. United States production is projected to be down almost 20% over last year. The keyword I want to highlight here is projected. See below for a more detailed view of the projections: (click to enlarge) Chart obtained from the USDA. The reason I was highlighting the word “projected” is because some Texas farmers were on record saying that they believe the numbers for abandonment are way off. These farmers are part of a coalition that represents 60% of the states production. Abandonment is when farmers plant the crop, but do not harvest it due to low market prices or other market conditions. If this had been a farmer from New Mexico, no one would pay attention. However, Texas is the largest state for U.S. cotton production, by a long shot. Earlier this year we discussed how the flooding there delayed the planting but farmers were still expected to get a full harvest in. Bottom line from this report is that yield per acre is down a bit and the number of planted acres is down significantly. The conclusion I come to is that even if Texas farmers have lower abandonment numbers, they will not be able to completely overcome the overall drop in yield and planted acreage. BAL Let’s view the price action of BAL over the last month: (click to enlarge) Chart obtained from Optionshouse.com Here is another view showing the percentage of change: BAL has been hampered by the continuing decline in crude oil prices. See the crude chart below: I have been in the camp that crude oil is going to rebound to about $60 per barrel by the end of the year. I had sold a few Puts on The United States Oil Fund (NYSEARCA: USO ), but bought them back recently for a small loss. Given the current supply and demand factors and market factors, I don’t know if we will see $60 by years end. Saudi Arabia seems bent on eliminating competition, Iran is coming online, U.S. production has not slowed drastically, and demand has not increased substantially. The U.S. dollar is a wild card with a projected Fed liftoff this September. A stronger dollar means additional pressure on oil. How is all of this affecting BAL? Cotton will face continued price pressure from cheap oil. This presents the case more for a ceiling on spot prices than a floor. I suspect it was the lower prices of crude that swayed farmers to plant more profitable crops this year than the lower spot price of cotton. Oils first plunge this year came right before peak planting season for cotton. Conclusion In closing, I believe the USDA’s numbers and projections are more in line with reality than the Texas farmers are leading you to believe. However, if the farmers can obtain a more reasonable rate for their crop, then naturally abandonment will decrease, further increasing supply. The global supply and demand of cotton remains stable. Stocks are still trending lower off of their all-time highs but are still not being reduced enough to make a substantial impact on the spot price of U.S. cotton and in turn BAL. I would use caution with this current spike in spot prices. I do not see this a buy signal. Given the current state of crude prices, I see higher risks to the downside for cotton going forward. I would keep an eye out for the September USDA reports to see if their current projections hold or are revised. If the Texas farmers are correct about the abandonment, then I see higher than projected production and further downward pressure on spot prices. This would have the opposite effect of the nice green candle you see in the chart above. By November, I hope to have a full report out for you on my 2016 outlook for cotton. I see 2016 as a more profitable year for BAL as lower cotton production reduces supply and we finally see a rebound in crude prices. Crude remains a wild card and anything can happen with the flick of a Middle Eastern switch. If you are investing in BAL your current focus should be the monthly USDA reports (and any other production news) and crude. As we enter peak harvesting season for cotton, those monthly reports are very valuable. As always, I appreciate you reading and I hope you have a profitable end to 2015! Disclosure: I/we have no positions in any stocks mentioned, and no plans to initiate any positions within the next 72 hours. (More…) I wrote this article myself, and it expresses my own opinions. I am not receiving compensation for it (other than from Seeking Alpha). I have no business relationship with any company whose stock is mentioned in this article. Scalper1 News
Scalper1 News