Scalper1 News

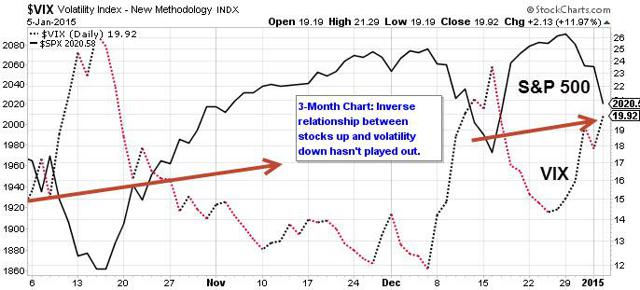
 By Ronald Delegge When stocks go up, volatility goes down and vice versa. While this historically inverse relationship plays out most of the time, there’s been a significant disconnect as of late. The chart below illustrates this disconnect. As you can see, over the past three months, the S&P 500 (black line) has gained around 2.7% yet the S&P 500 volatility (ChicagoOptions:^VIX) (dotted line) has surged almost 37%. Shouldn’t the VIX be declining when stocks (NYSEARCA: IVV ) are rising? What’s going on? (Audio) Portfolio Report Card: Ron DeLegge Grades a $1.5 Million Portfolio… Pass or Fail? (click to enlarge) On Dec. 17, 2014 via our Weekly ETF Picks we alerted readers about this volatility trend by writing: “Although the S&P 500 volatility index (VIX) has fallen over the past few days, the VIX has been on a tear, gaining almost 40% since early December. Here’s what’s particularly notable about that move: the S&P 500 (SNP:^GSPC) was down only -1.26% over that same time frame! If VIX can soar almost +40% on a -1.25% loss, what type of potential does it have for a sharper pullback? We’re buying the ProShares VIX Short-term Futures ETF (NYSEARCA: VIXY ) and our tandem options trade (for investors that want more leverage) is to buy VIX call options (strike price and monthly expiration reserved for subscribers).” How has it worked out? Thus far, we’ve already bagged a nearly 35% gain on our VIX call options trade and our VIXY trade is ahead by almost 10% since we initiated our trade alert. Bottom line: We interpret the three-month trend of higher stock prices coupled with higher volatility as extremely bullish for long VIX trades. Original Post Disclosure: None Now that you’ve read this, are you Bullish or Bearish on ? Bullish Bearish Sentiment on ( ) Thanks for sharing your thoughts. Why are you ? Submit & View Results Skip to results » Share this article with a colleague Scalper1 News
Scalper1 News