Scalper1 News
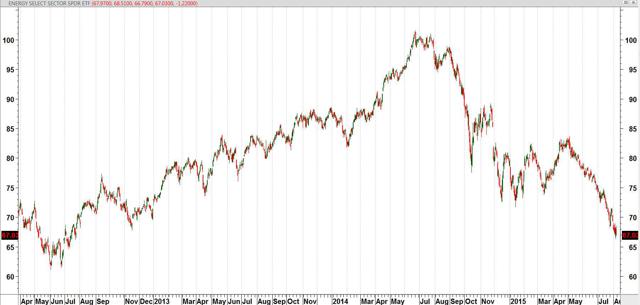
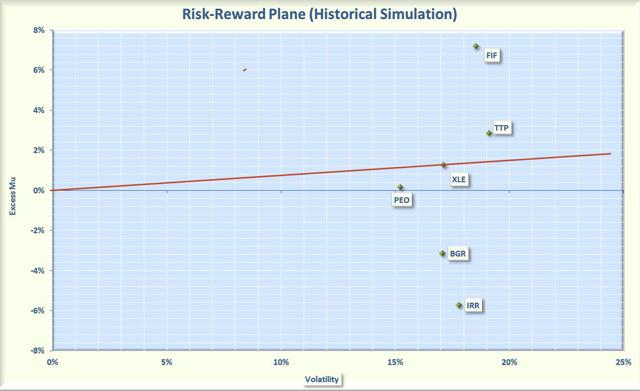
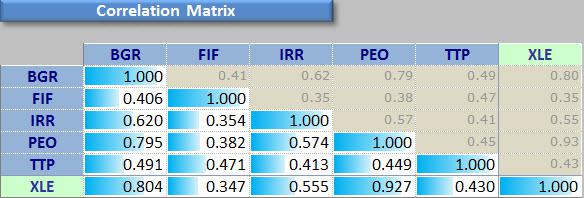
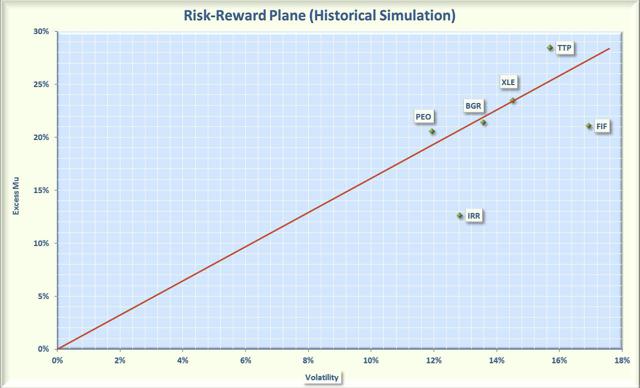 Summary Energy CEFs have been hit hard over the past year, resulting in potential bargains. Energy CEFs offer enticing income while you wait for the sector to recover. My picks are PEO and TTP for long term risk-adjusted performance when the bull returns. I am primarily an income investor but I have a contrarian streak and believe in the wisdom of Warren Buffet when he opined: “Be greedy when others are fearful.” This advice has never been truer than now when you consider the total collapse of the energy market. West Texas Intermediate (WTI) oil has plummeted from $104 per barrel in June of last year to less than $50 a barrel today. This has driven down energy stocks to what I consider bargain basement levels. The rapid fall of energy stocks is illustrated by plot of the price of the Energy Select Sector SPDR Exchange Traded Fund (NYSEARCA: XLE ) shown in Figure 1. This ETF is a passive cap-weighted fund that tracks the price of 41 of the largest energy companies. It has an expense ratio of only 0.15% and yields 2.9%. The plot shows that prices peaked in July of last year and has since fallen over 33%. (click to enlarge) Figure 1: Plot of XLE over past 3 years I am not clairvoyant and have no idea how long it will take the energy sector to recover. However, I am confident that over the long run, oil will again return to its glory days. This is based on past history coupled with the number of trouble spots around the world that could disrupt the supply of oil. So I have begun accumulating beaten-down energy stocks. To accomplish this, I am a fan of using Closed End Funds (CEFs) because they are actively managed and offer attractive distributions while you wait for the recovery. There are only four CEFs that focus on energy and have at least a 3 year history. I did not include CEFs that invest primarily in precious metals or master limited partnerships (NYSEARCA: MLPS ). If you are interested in MLPs, please see my article that I recently wrote on Seeking Alpha. The CEFs I included in the analysis are summarized below. Adams Natural Resources (NYSE: PEO ). This CEF was formerly known as Petroleum and Resources and is one of the oldest CEFs, having begun trading on the NYSE in 1929. The fund sells at a discount of 15.2%, which is a slightly larger discount than the 3 year average of 14%. The portfolio consists of 39 companies in the energy and natural resource sectors. It utilized less than 1% leverage and has an expense ratio of 0.6%. The distribution is $0.10 per quarter which is only 2% but it also typically distributes a large capital gain at the end of the year. Last year the capital gain was $1.59, which brought the yearly distribution to $1.99 or almost 10%. None of the distribution was return of capital (NYSE: ROC ). The fund has an exceptional track record and has paid capital gains for 63 consecutive years and dividends for 80 consecutive years. The fund has made a commitment to pay distributions equal to at least 6% of the fund trailing 12 month average price. BlackRock Energy and Resources (NYSE: BGR ). This CEF sells at a discount of 11.4%, which is a larger discount than the 3 year average discount of 7%. This fund is concentrated and has only 30 holdings, all from the energy sector. About 75% of the companies are domiciled in the United States with the rest primarily Canadian and European companies. The fund does not use leverage and has an expense ratio of 0.3%. However, the fund may use options to enhance dividend yield. The distribution has been $0.135 per month but was dropped to $0.11 for August. The fund distributed $1.14 in December of last year. Unfortunately the distributions this year have been mostly return of capital. It is difficult to assess if this is destructive ROC because of the option income plus the fact that the Undistributed Net Investment Income (UNII) is only slightly negative. If readers have more insight, please let me know. First Trust Energy Infrastructure (NYSE: FIF ). This CEF sells at a discount of 15.3%, which is a larger discount than the 3 year average of 7.7%. The portfolio has 70 holdings and focuses on energy infrastructure, with 26% in MLPs and the rest invested in energy companies. About half the holdings are in the pipeline industry and about 24% are associated with electric power. This fund utilizes 25% leverage and has an expense ratio of 1.8%. The distribution is 0.11 per month with capital gains of $1.43 paid last November. Most of the distributions do not rely on ROC and UNII is positive. Tortoise Pipeline and Energy (NYSE: TTP ). This CEF sells for a discount of 15.1%, which is a larger discount than the 3 year average of 8.5%. The portfolio has 60 holdings consisting of 24% MLPs, 65% pipeline corporations, and 10% integrated oil companies. About 30% of the holdings are domiciled in the U.S. The fund utilizes 22% leverage and has an expense ratio of 2.1%. The distribution is 5.3%, consisting of income, capital gains, and a relatively small amount of ROC. The UNII is large and positive, which is a good sign. Voya Natural Resources, Equity (NYSE: IRR ). This CEF sells at a discount of 13.2%, which is a larger discount than the 3-year average discount of 8.6%. The portfolio consists of 84 holdings with 20% from integrated oil companies, 26% from exploration and production companies, and 16% from oil services. About 89% of the holdings are domiciled in the U.S. This fund uses a covered call strategy to enhance returns and does not utilize leverage. The expense ratio is 1.2%. The distribution a huge 15.7%, consisting primarily of short term gains. The fund has not used ROC over the past year and the UNII is positive. To assess the performance of the selected CEFs, I plotted the annualized rate of return in excess of the risk free rate (called Excess Mu in the charts) versus the volatility of each of the component funds over the past 3 years. The risk free rate was set at 0% so that performance could be easily assessed. This plot is shown in Figure 2. Note that the rate of return is based on price, not Net Asset Value (NYSE: NAV ). (click to enlarge) Figure 2. Risk versus reward over the past 3 years. The plot illustrates that the CEFs have booked a wide range of returns and volatilities over the past 3 years. To better assess the relative performance of these funds, I calculated the Sharpe Ratio. The Sharpe Ratio is a metric, developed by Nobel laureate William Sharpe that measures risk-adjusted performance. It is calculated as the ratio of the excess return over the volatility. This reward-to-risk ratio (assuming that risk is measured by volatility) is a good way to compare peers to assess if higher returns are due to superior investment performance or from taking additional risk. In Figure 2, I plotted a red line that represents the Sharpe Ratio associated with XLE. If an asset is above the line, it has a higher Sharpe Ratio than XLE. Conversely, if an asset is below the line, the reward-to-risk is worse than XLE. Note also that Sharpe Ratios are not meaningful if a stock has a negative return. Some interesting observations are evident from the figure. The energy CEFs exhibited a relative tight range of volatilities that were similar to XLE. This was somewhat surprising since I expected CEFs to have higher risks than the passive XLE (because the CEFs are actively managed and some use leverage which could increase volatility). Overall, as expected, energy funds did have great performance over the period. The funds that focused on energy production and exploration fared the worst while the infrastructure funds (FIF and TTP) performed the best. The funds that utilized an option strategy (BGR and IRR) were the worst performers. On both an absolute basis and a risk-adjusted basis, TTP and FIF outperformed XLE. PEO had about the same risk-adjusted performance as XLE but both only managed to eke out a small positive total return. PEO was the least volatile of the group. Since all the funds were associated with natural resources, I wanted to assess how much diversification you might receive by buying multiple funds. To be “diversified,” you want to choose assets such that when some assets are down, others are up. In mathematical terms, you want to select assets that are uncorrelated (or at least not highly correlated) with each other. I calculated the pair-wise correlations associated with the funds. The results are presented in Figure 3. Figure 3. Correlation over the past 3 years The figure presents what is called a correlation matrix. The symbols for the funds are listed in the first column on the left side of the figure. The symbols are also listed along the first row at the top. The number in the intersection of the row and column is the correlation between the two assets. For example, if you follow TTP to the right for three columns you will see that the intersection with IRR is 0.413. This indicates that, over the past 3 years, TTP and IRR were only 41% correlated. Note that all assets are 100% correlated with themselves so the values along the diagonal of the matrix are all ones. As shown in the figure, BGR and PEO were highly correlated with XLE. Thus, you do not receive substantial diversification benefits by purchasing more than one of these funds. On the other hand, FIF, IRR, and TTP were not highly correlated with each other or XLE. Thus, the funds would provide good diversification if you already own PEO or XLE. The 3 year look-back data shows how these funds have performed in the past. However, the real question is how they will perform in the future when the bull market in energy returns. Of course, no one knows but we can obtain some insight by looking at the most recent bull market period from July, 2012 to July, 2014. As shown in Figure 1, this was a great period for energy firms. Figure 4 plots the risk versus reward for the funds over this bull market time frame. As expected, all the funds did well and most (with the exception of IRR and FIF) had about the same risk-adjusted performance. Both IRR and FIF lagged during the bull market but TTP was the best performer. (click to enlarge) Figure 4. Risk versus reward during a bull market Bottom Line Energy CEFs are selling at large discounts and if you believe the bull market in energy will return over the near term, you should consider investing in CEFs. I would recommend PEO and TTP. PEO has a great long term record and I like it better than XLE. I would also consider adding TTP, which is relatively uncorrelated with PEO and did exceedingly well during the last bull market. Both of these funds offer good diversification and income while you wait for the bull to return. Disclosure: I am/we are long PEO, TTP. (More…) I wrote this article myself, and it expresses my own opinions. I am not receiving compensation for it (other than from Seeking Alpha). I have no business relationship with any company whose stock is mentioned in this article. Scalper1 News
Scalper1 News