Scalper1 News
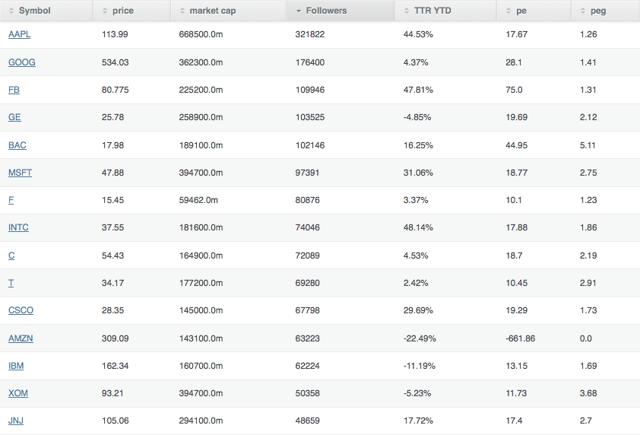
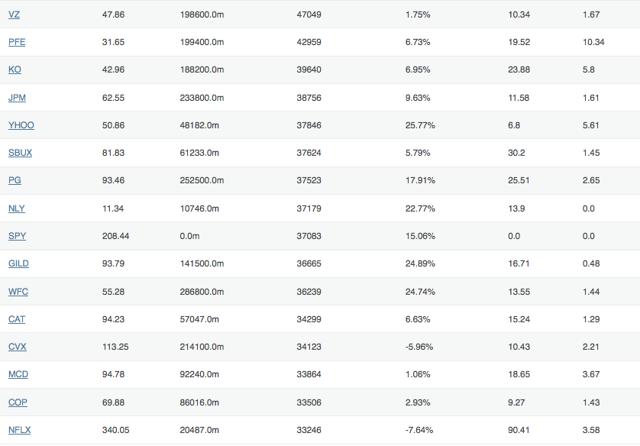
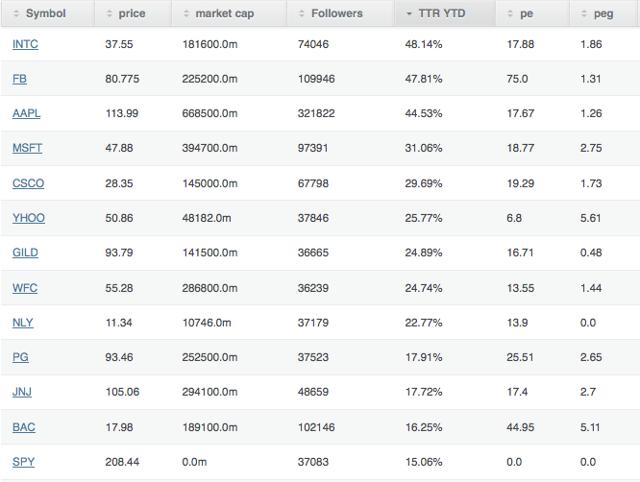
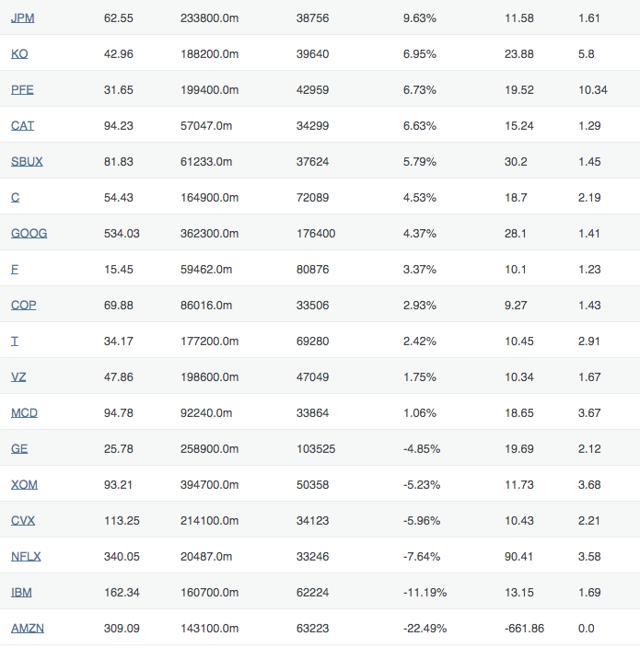
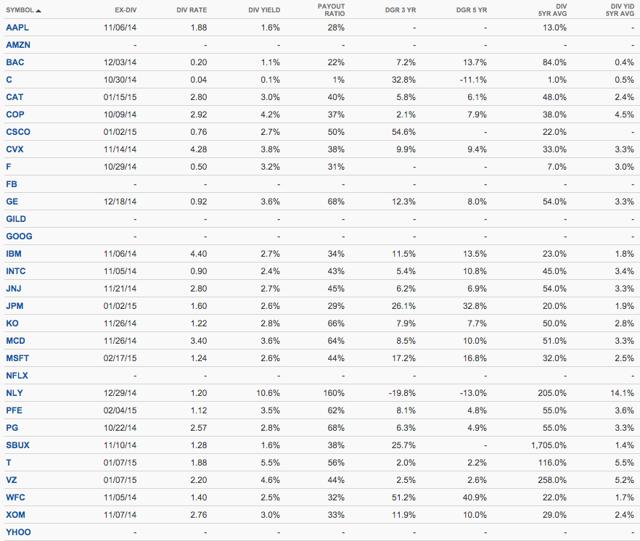 Summary In this article we examine how a portfolio created from the most followed stocks on Seeking Alpha would have performed in 2014. We create three portfolios: equal weighted, weighted based on the number of followers and weighted based on market cap. How did the portfolios do? Read on to see the results. The Most Followed Stocks The SA 30 in order of popularity: (click to enlarge) (click to enlarge) Total_Return data is from Morningstar (1/1/2014 – 12/26/2014), except for GOOG, which is from Y-CHARTS. Sixteen Dow components make the list: T, CAT, CVX, CSCO, KO, XOM, GE, IBM, INTC, JNJ, JPM, MCD, MSFT, PFE, PG and VZ. By Sector the Portfolio breaks down as follows: Basic Materials: COP, CVX and XOM Consumer Goods: PG, F, AAPL and KO Financial: BAC, C, JPM, NLY and WFC Healthcare: PFE, JNJ and GILD Industrial Goods: GE and CAT Services: MCD, NFLX and SBUX Technology: T, VZ, YHOO, MSFT, GOOG, IBM, INTC, FB, and CSCO Performance (click to enlarge) (click to enlarge) Thirteen of the 30 stocks outperformed SPDR S&P 500 Trust ETF (NYSEARCA: SPY ) Year to Date. The equally weighted portfolio has a Total Return YTD of: 11.67% The equally weighted portfolio current yield is: 2.56% Technology companies lead the best performers with INTC, FB, AAPL, MSFT, CSCO and YHOO leading the pack. Five companies have negative Total Return YTD: GE, XOM, CVX, NFLX, IBM and AMZN. The equal weighted portfolio under performs SPY by a significant margin, returning 11.67% compared to 15.06%. It does have a respectable yield of 2.56%. A portfolio weighted by number of followers: Stock Percentage of Portfolio Apple (OTC: AAPL ) 15.62% Google (NASDAQ: GOOG ) 8.56% Facebook (NASDAQ: FB ) 5.34% General Electric (NYSE: GE ) 5.02% Bank of America (NYSE: BAC ) 4.96% Microsoft (NASDAQ: MSFT ) 4.73% Ford (NYSE: F ) 3.93% Intel (NASDAQ: INTC ) 3.59% Citigroup (NYSE: C ) 3.50% AT&T (NYSE: T ) 3.36% Cisco (NASDAQ: CSCO ) 3.29% Amazon (NASDAQ: AMZN ) 3.07% International Business Machine (NYSE: IBM ) 3.02% Exxon Mobil (NYSE: XOM ) 2.44% Johnson & Johnson (NYSE: JNJ ) 2.36% Verizon (NYSE: VZ ) 2.28% Pfizer (NYSE: PFE ) 2.09% Coca-Cola (NYSE: KO ) 1.92% JPMorgan Chase (NYSE: JPM ) 1.88% Yahoo! (NASDAQ: YHOO ) 1.84% Starbucks (NASDAQ: SBUX ) 1.83% Procter & Gamble (NYSE: PG ) 1.82% Annaly Capital Management (NYSE: NLY ) 1.80% Gilead Sciences (NASDAQ: GILD ) 1.78% Wells Fargo (NYSE: WFC ) 1.76% Caterpillar (NYSE: CAT ) 1.66% Chevron (NYSE: CVX ) 1.66% McDonald’s (NYSE: MCD ) 1.64% ConocoPhillips (NYSE: COP ) 1.63% Netflix (NASDAQ: NFLX ) 1.61% The Total Return YTD of the SA 30 weighted by followers: 16.9% SA 30 weighted by followers yield: 2.15% Weighting by number of followers provides better returns and beats SPY with returns of 16.9% compared to 15.06%. This portfolio is not very diverse with AAPL making up 15.62% (no wonder there are so many articles about AAPL) and the top four holdings make up over a third of the portfolio. Portfolio Weighted by Market Cap: Stock Percentage of Portfolio Apple 11.31% Exxon Mobil 6.68% Microsoft 6.68% Google 6.13% Johnson & Johnson 4.98% Wells Fargo 4.85% General Electric 4.38% Procter & Gamble 4.27% JPMorgan Chase 3.96% Facebook 3.81% Chevron 3.62% Pfizer 3.37% Verizon 3.36% Bank Of America 3.32% Coca Cola 3.18% Intel 3.07% AT&T 3.00% Citicorp ( C ) 2.79% International Business Machine 2.72% Cisco 2.45% Amazon 2.42% Gilead Sciences 2.39% McDonald’s 1.56% ConocoPhillips 1.46% Starbucks 1.05% Ford 1.01% Caterpillar 0.97% Yahoo! 0.82% Netflix 0.35% Annaly Capital Management 0.18% The Total Return YTD of a portfolio weighted by Market Cap: 15.27 Market weighted Portfolio Current Yield: 2.32% The portfolio weighed based on Market Cap narrowly beats SPY: 15.27% to 15.06%. This portfolio is also lacking in diversity with the top four holdings making up over 30% of the portfolio. Dividend Data (click to enlarge) All dividend data is from Seeking Alpha The list contains seven dividend aristocrats: T, CVX, KO, XOM, JNJ, MCD and PG. The same seven stocks are also dividend champions. Dividend Contenders or Challengers: COP, VZ, IBM and SBUX Of these eleven stocks that made at least one of the above lists only two outperformed the SPY for total return YTD: PG and JNJ. A fluke or were these best of breed DGI stocks overbought coming into 2014? Eleven of the stocks have yields of 3% or greater: NLY, T, VZ, COP, CVX, GE, MCD, PFE, F, XOM and CAT. Conclusions Overall the most followed stocks on SA had uninspiring performance. With equal weighting the top 30 underperformed the SPY. Weighted by number of followers they did better – but not significantly. From my perspective, this is not that surprising; although I believe the SA crowd as a whole is an intelligent investment community, it’s hard to outperform when selecting stocks that are so closely followed. Others may come to different conclusions – please comment I’d like to know what you think. Ideally I would have liked to do this based on the most followed stocks as of January first of 2014, I unfortunately did not have that data. My plan is to periodically report on this portfolio in 2015 so we can get a better calibration of how the most followed stocks at the beginning of the year perform going forward. I did not check the number of followers for every ticker in the SA stock universe. I checked the entire S&P 500 and a few hundred others. If anyone believes that I have missed a stock that should be in the Top 30, please let me know. I selected 30 stocks to match the number of stocks in the DJI. I can be convinced to add more if readers feel it would be useful. Obviously there is more data and inferences that can be made about these stocks – if you have any particular requests let me know. I am not a professional advisor or researcher. I am an individual investor who studies investing and shares my thoughts. I encourage all investors do their own due diligence and please share your findings. I strongly feel the best thing about Seeking Alpha is the sharing of ideas. Please comment; I value your input. Divergent opinions are welcome. Editor’s Note: This article discusses one or more securities that do not trade on a major exchange. Please be aware of the risks associated with these stocks. Scalper1 News
Scalper1 News