Scalper1 News
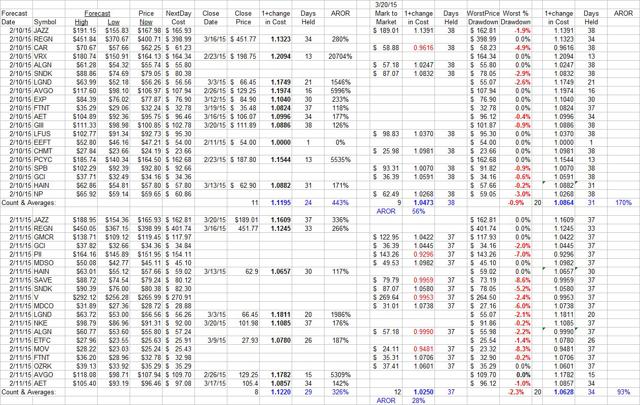
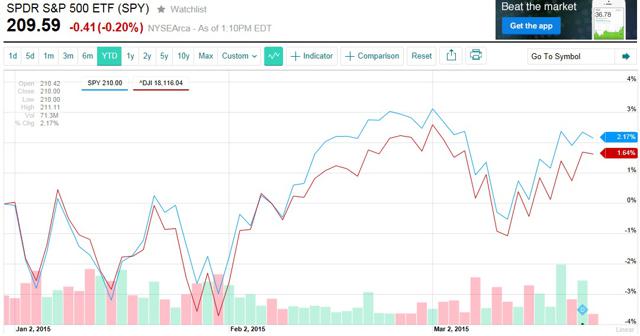 Summary Every market day we rank 30 stocks (out of 2,500) with the best price gain prospects, using intelligent behavior analysis on the hedging actions of market makers. Considerations include odds for and size of prospective payoffs, prior performance of market professionals’ expectations like those of today, and worst-case prior price drawdown experiences. Only those with 3 years or more of prior daily forecast histories and dozens of forecasts with similar upside-to-downside price change expectations are selected. We don’t pick, we leave that crucial task to you Our hope is that by illustrating the startling opportunities presented every day, ones that can be captured by just paying attention, having perspective, and following thoughtful disciplines – individual investors may be encouraged to self direct their investments. For many investors, far too much time has slipped by, and goals or needs for expenditures that were to be funded from investment capital are now under serious time threat pressure. Those who recognize the problem with desperation may fall into a trap of attempting actions that involve risks likely to turn investors into unvestors. Those who do not yet recognize the problem are already in a trap likely to lead to the desperation just described. It is stealthy and subtle, this time erosion, because it takes no effort to perpetuate it. The effort is in making a change. The principal change needed is to turn from being a passive investor in market indexes to being an active investor in specific equity issues. Becoming an active investor requires becoming time conscious. Adopting an investing discipline that forces periodic reappraisals of investments is important, and quite doable if approached incrementally, rather than as one of those monster “clean/organize the attic or the garage” projects. I have a suggestion I’d like you to consider: Take a small part of your present stock portfolio, say 2%-3%. If no one holding is that small, consider chipping off a piece of a larger position. Then find an alternative investment you can believe in and set a time deadline for it to reach a price target that you think is possible to be reached. The position holding period should be 3 to 6 months, no longer. Make a record of your target and find a free internet tool that will send you an alert when the target is reached or when a date arrives. Do this at least once a week, or a couple of times a week. There are 13 weeks in 3 months, so a twice a week (or two actions at the same time) will take care of repositioning 50% to 75% of your existing portfolio (2 x 3% x 13 = 78%). Four months at that rate would get the whole thing reinvested. Chances are that you may not have seriously looked recently at much of what you have been holding. The usual passive approach is just a periodic look to see what is up and what is down, with little real concern over selling anything that has gone up. Maybe just some worries over the one(s) that have gone down. That is often the wrong reason to sell, and usually the wrong time. Instead, under the suggested program, the time to sell is just as soon as your sell target is reached. That is when to look around to see what alternatives are available that have the price energy that can outpace the stock that has just done so well for you, the one that may need some rest before continuing. Selling out the good performer forces a genuine re-examination of what may do better, and tends to prevent overstaying a success. What cripples the “buy & hold” dementia strategy is the almost inevitable price round-tripping. It erodes both capital once achieved and the time required to recapture the subsequently lost capital. Rate of return then suffers severely. The other time to sell is when the initial decision to invest turns out, after your holding period time limit has elapsed, to either be a loser or is taking too long to reach target. An ample supply of good performers is regularly available that can take their place. But just hoping that something will yet work, something that has not worked after a fair investment of time has been made, is usually a mistake. And mistakes of selection will inevitably be made. Remember, everything you do depends on some other player in the game being willing to do the opposite. Often they may be attempting the same thing you are. You won’t win every price contest, but you can be frugal with the amount of time you will invest. Strangely, those time competitions turn out often to be much easier to win because establishment investment thinking (passive investment, buy & hold) is very careless with time. The strategy of keeping time investments to small amounts is a lot like diversifying capital among multiple holdings in a portfolio. Time also can be diversified. That is why in the start-up phase I suggest actions should be spread out over 3 or 4 months. With commitments having staggered holding time dates, their reinvestment becomes an incremental process, avoiding concentrations of actions in brief periods that may turn out to be an unfortunate choice. Another facet of the strategy that tends to shuffle the time deck is that stock prices can often move on irregular schedules. Sell price targets get reached in many cases before holding time limits impose action. The reinvestment of that enlarged capital compounds the returns earned multiple times in a year, often to a degree making buy & holders see far more green in envy than in their own portfolios. But can this strategy be accomplished? Investment markets, particularly in equities, are inevitably “noisy” places in price change terms. Often casual investors are encouraged to be oblivious of what actually goes on. Money managers make a lot more profits for themselves in management fees paid by an existing client base than they can get from new customers. New customer development is expensive, so retention of existing business is of high order. The less aware that investor clients are of price declines, the less likely they are to become distressed and leave, taking their capital and its management fees with them. So active monitoring by clients of their own accounts is discouraged, and the opportunities presented are rarely seen. A smart shopper I know often has told me “the time to buy things is when they are on sale.” It even happens with stocks. To illustrate what actually goes on, I present two consecutive days of what has recently been the action in ranked lists of stocks selected by our analysis process. The purpose is not to show how good we are as stock pickers, but to show how extreme are market price moves, and what a time efficient investment strategy like the one described can produce. The two days are not a random selection, but are “cherry-picked” to show how irregular are many price moves in the market. The days are February 10th and 11th of this year, and the information is in the form of intelligence lists we provide for subscribers from our daily analysis. Here in late March, there has been only about five weeks since these lists were originated, yet about half of the 20 names on each list have reached their sell targets. Several price change events are contained that may be surprising, but are actually rather ordinary. Figure 1 (click to enlarge) Figure 1 lists the selected stocks by symbol, with a number of issues repeated in the second day because they continued to be competitive for investor attention. But the passage of only one day can make a significant difference, as will become evident. Let’s look at how the lists are organized. As received by subscribers, the data columns (3)-(5) are the most important, and the remaining columns (6)-(19) were prepared for this article to describe what has happened since the lists were originally published. The price range forecasts offer as sell targets, in (3), the highest prices expected by market professionals. Possible low prices are in (4), and the current end of day quotes are in (5). Since the only buy orders that can be achieved at an assured price of record are “at opening” or “at closing”, we take the close price next day after forecast (6) as our cost of record. End of day [EOD] prices are checked daily to watch for target achievements, which are recorded as they occur (7) at the close price (8). Such gains are recorded in a numeric form that supports appropriate combination with other results in (9) and the holding period (investment of time) is noted in (10). The annual rates of gain thus achieved are shown in (11). A careful look at Regeneron (NASDAQ: REGN ) on 2/10/15 shows a target of $451.84, yet we have taken a close at only $451.77. Real life experience in investing urges “bird in hand” when the target is that close. Would you have for 7 cents missed the opportunity to get 99.98% of your target? We wouldn’t, and took the close. REGN closed the following day (3/17/15) at $467.80. That’s real life in investing. The REGN forecast on 2/11 produced a sell target of only $450, so the $451 close on 3/16 operated as planned (denying us the next day’s higher closeout potential, drat it!). Positions still striving for closure, as is Jazz Pharmaceuticals (NASDAQ: JAZZ ) in this illustration, are marked to market in (12) on the date indicated at the top of the column. Data parallel to (9)-(10) are held in (13)-(14) for performance compilation purposes. Risk analysis is shown in the form of worst stress points due to interim EOD market quotes (15) being below investment costs (6). The stress is shown as percentages “underwater” in (16) during the actual periods of time investment (10) or (18). Please note that the investor following such a program needs only the information in (3)-(6), but may want to keep score in (7)-(8) for personal satisfaction. Daily price monitoring and target achievement alerts can be delegated to many online cost-free services that require no routine actions other than responding to alerts. That helps keep more precious personal time free for your more important involvements. Summations of progress in Figure 1 are shown in the rows captioned as “Count and Averages”. Column (9) is averaged by geometric mean, (10) by arithmetic mean, and the daily root mean of the average gains is raised to an annual rate by power of ^365. This explanation is simply to reassure readers so inclined that measurements are done properly. In every day English this can be stated for the 2/10/15 list’s achievements to date, that the 11 selections reaching their targets in 24 calendar days of average time investment, gains of about +12% were achieved, or some ½% a day, which would compound over a year to a gain of 443% on the original investment. But that’s just the “winners” so far. Another 9 strivers have been laboring for 38 days each and have only captured gains of about 4 ¾%. Their annualized gains are at a rate of +56%. Combining the two sets in (17) and (18) brings up an average gain of 8 5/8% requiring time investments of 31 calendar days and produces an annual rate of +170%. Not +7% or +17%, but +170%. A $1,000 investment in each of the 20, if sustainable at this rate for a year, would turn the $20,000 into $54,000 (20 x 1.7 x 1000 + the original $20k). The same analysis for the next day’s best 20 selected list looks to be about half as good. Only 8 of the 20 picked on 2/11/15 have reached their targets, their payoffs are a little bigger, +12.2%, but take 29 days, on average, so their AROR is +326% instead of the prior day’s winners’ AROR of +443%. But the real difference is in those positions not yet closed out, where marks to the market show average gains of only +2 ½% instead of the prior day’s +4.73%. What makes the difference is that 5 of the 12 still reaching for their sell targets are marked to market below cost (in red in (13)), compared to only one “underwater” from the day before list. Further, the risk experiences (16) of the selections from 2/11/15 have been more stressful than those of the 2/10. They averaged a -2.3%, compared to not even -1% the day before. More critically, there were examples on 2/11 of price drawdown extremes of more than -8%, while the prior day’s worst was not even -5%. All in all, the risk experiences so far on 2/10 have been exceptionally kind – what might be hoped for, but not really expected. Still, the present state of the 2/11 selections is quite good, with an aggregate AROR on its 20 choices at +93%. These lists were chosen as illustrations because they offered ample examples of what can and does happen on an every day basis in equity investment markets. For example, please note the selection on 2/10 of the ETF Euronet Worldwide (NASDAQ: EEFT ). On the day following its selection, its price jumped to $54 from $47.21. Our scorekeeping discipline of using the EOD price on day after the forecast conflicted with the sell target of $52.80. So on our book it never got bought or sold, but a purely neutral presence is shown for the record. Since the first of this year, there have been 224 positions such as those illustrated here, closed out of 822 selections. The closes have averaged +12% gains on time investments of 27 calendar days, or an annual rate of some 360%. Those still open on 3/20/15, including ones only initiated in the past few days, have a marked-to-market gain of about +2%. All combined, the 822 have a +7.7% gain on a time investment of some 28 days, or an annual rate of +196%. Conclusion The year-to-date period has provided a modestly fluctuating, pretty much go nowhere environment for passive equity investors, as pictured here in Figure 2. The SPDR S&P 500 Trust ETF (NYSEARCA: SPY ) is up +2% and the DJIA is up +1.6%. Figure 2 (click to enlarge) But active investors have had ample opportunities to build wealth at a startling rate, even without major market index moves. This period is not unusual; the equity markets are “price noisy” markets at all periods when actually examined in detail. The trick is to be willing to invest one’s personal energy in making timely choice decisions based on one’s due diligence examination of the alternative vehicles available. There are endless sources of supporting research and evaluation services to help you out based on a wide variety of strategies and approaches. Explore a bit and try out a few to see which ones make sense to you and can provide the support guidance you seek. But start now, while you are thinking about it. Because your most precious resource, TIME, is quietly, subtly, passing, never to be retrieved. Disclosure: The author has no positions in any stocks mentioned, and no plans to initiate any positions within the next 72 hours. (More…) The author wrote this article themselves, and it expresses their own opinions. The author is not receiving compensation for it (other than from Seeking Alpha). The author has no business relationship with any company whose stock is mentioned in this article. Scalper1 News
Scalper1 News