Scalper1 News
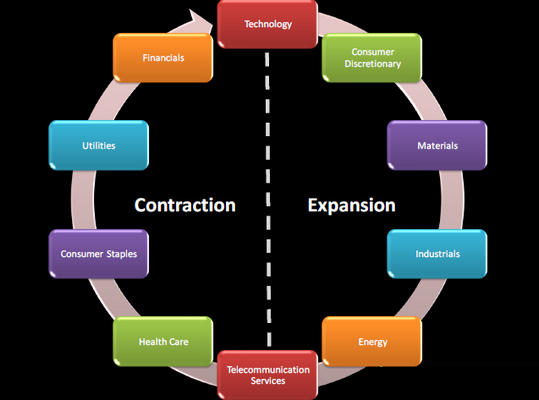
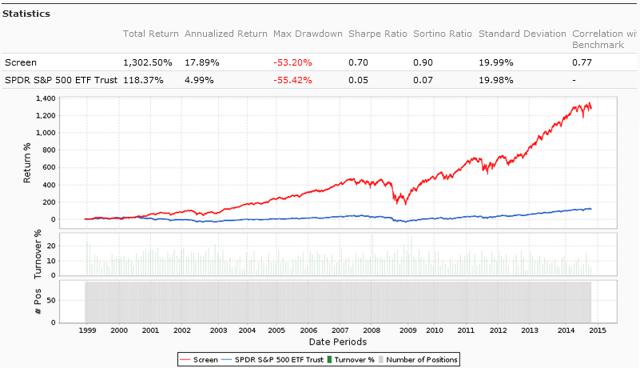
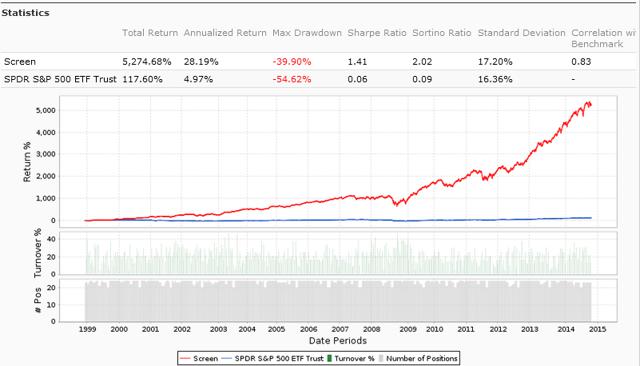 Summary Sector diversification is a key in market neutral investing. Two examples. Questions to solve for IRA compatibility. My previous article described the investor profile to hold a market neutral portfolio and some characteristics of this investing style illustrated by examples. I also explained why I prefer using an index ETF for the short side of the portfolio. In the next step, I want to focus on the benefit of sector diversification in market neutral investing. Sector diversification is especially important when the objective is to beat the benchmark in all market conditions, that is to say in all phases of the expansion-contraction cycle. The reality is more complicated than the figure. Cycles of different and variable periods may be in play, and macro trends can freeze the cycle for some sectors (like oil price does for energy and materials). In fact, it is sometimes quite difficult to figure out where we are and on which time frame when various cycles are combined. This is why, if an index ETF is on the short side, the long side of the portfolio must be diversified, not necessarily in all sectors, but at least in a few cyclical and defensive sectors. Since the return of such a Market Neutral Portfolio is the alpha of the long side, diversification in defensive and cyclical stocks is a key to keeping drawdowns acceptable in duration. In my opinion, the historical maximum duration in drawdown of an investing strategy is a parameter as important as the return and volatility. Examples I have performed a simulation of a portfolio mixing all the S&P 500 strategies of my book «The Lazy Fundamental Analyst» (Harriman House 2014). There are 9 strategies, one for each sector of the GICS classification, except Telecommunication (which is very small to elaborate statistical models). Each strategy selects 10 S&P 500 companies using a simple ranking process based on 2 fundamental factors. The factors are sector-dependent, chosen using historical statistics. The result is an equal-weighted portfolio of 90 stocks in a universe or 500, updated and rebalanced every 4 weeks. It is quite a big set (18% of the S&P 500 index) with various logics mixed, so the performance can hardly be suspected of being curve-fitted or random. Of course, past performance, real or simulated, is not a guarantee for future returns. But on such a portfolio it gives a good clue on the risk. The next chart shows the simulation of the 90-stock S&P 500 Lazy Portfolio (long side only) since 1999, with a 0.1% transaction cost and a 4-week rebalancing: (click to enlarge) The next table gives statistics of the excess return of the portfolio over the SPDR S&P 500 Trust ETF (NYSEARCA: SPY ) by 4-week periods, which corresponds to the market neutral portfolio with a leveraging factor 2, without the margin and carry cost for the “short half”. Average 4week return Average Annual return Max Drawdown Depth Max Drawdown Duration Avg gain / Avg loss 4week gain probability Kelly criterion Kelly crit. 95% confidence 0.94% 12.9% 20.5% 19 months 1.52 67% 0.46 0.35 Holding 90 stocks is a lot. In my real market neutral portfolio, I have reduced the number by: Excluding the most sensitive sectors to macroeconomic and geopolitical concerns: finance, energy and materials. My aim is not to get the best possible return, but a good return with a risk as low as possible. Optimizing the models to keep only 24 stocks with a diversification pattern, including at least 2 defensive sectors, 2 cyclical sectors and a minimum number of stocks in each of them. Optimizing to a lower number of stocks incurs a risk of curve fitting. However, with 24 holdings and various ranking logics, the risk remains quite low. The biggest danger of optimizing is not over-rating the possible return, but under-rating the real risk. In a diversified market neutral portfolio, the risk is limited by design. The next chart shows the simulation of my 24-stock portfolio (long side only) since 1999, with a 0.3% transaction cost and a 2-week rebalancing: (click to enlarge) This portfolio is more dynamic (rebalanced twice more often). It is also focused on large caps, but may hold a limited number of liquid small caps from the Russell 3000 index. Even if I use volume filters, I use a higher transaction cost to model a higher spread and slippage. The next table gives statistics of the excess return of the portfolio over SPY by 2-week periods, which corresponds to the market neutral portfolio leveraged twice, without the margin and carry cost. Average 2week return Average Annual return Max Drawdown Depth Max Drawdown Duration Avg gain/Avg loss 2week gain probability Kelly criterion Kelly crit. 95% confidence 0.79% 22% 11% 13 months 1.69 64.2% 0.43 0.36 These are examples. Ideas and steps can be reused with other quantitative models, or with a stock picking based on due diligence. The main idea here is to formalize and follow a sector-based diversification pattern. A next article will explain how to use leveraged ETFs to implement this strategy with a lower or no leverage (ProShares Ultra S&P 500 ETF (NYSEARCA: SSO ), ProShares UltraPro S&P 500 ETF (NYSEARCA: UPRO )), and the consequences of using inverse ETFs to avoid short selling (ProShares Short S&P 500 ETF (NYSEARCA: SH ), ProShares UltraShort S&P 500 ETF (NYSEARCA: SDS ), ProShares UltraPro Short S&P 500 ETF (NYSEARCA: SPXU )). Indeed market neutral investing can be implemented in an IRA account. Feel free to follow me if you don’t want to miss it. Data and charts: Portfolio123 Additional disclosure: Long SPXU as a hedge. Past performance is not a guarantee of future returns. Scalper1 News
Scalper1 News