Scalper1 News
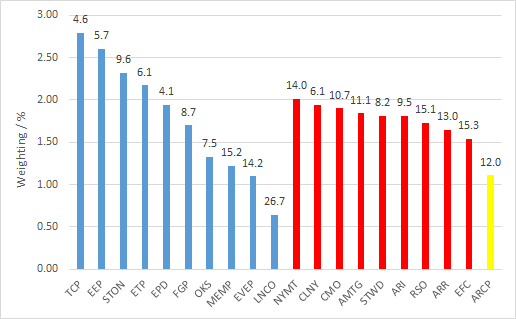
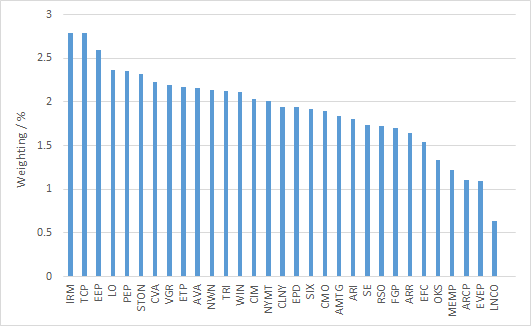
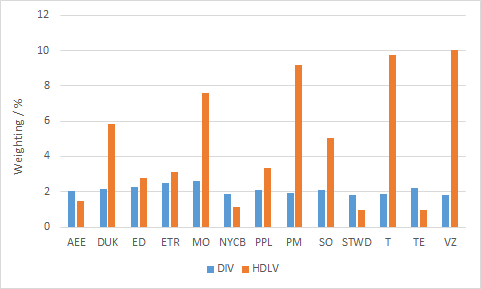
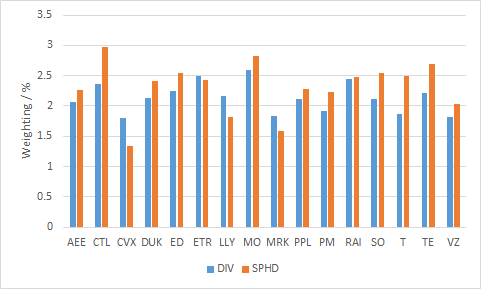
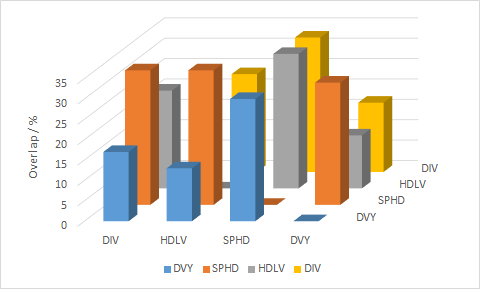
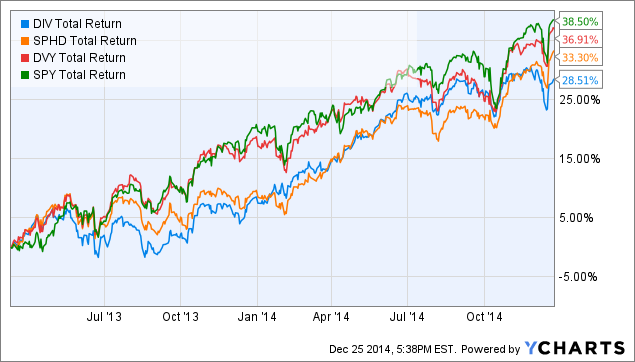
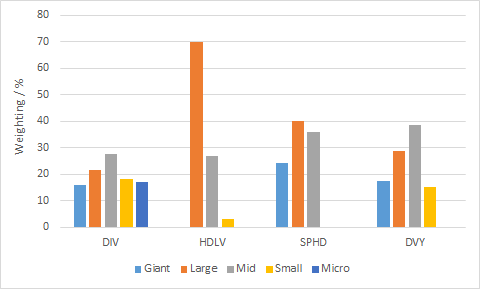
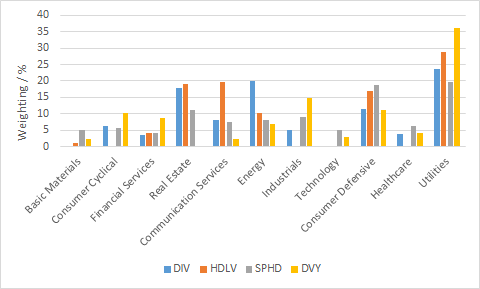
 Summary This is the third piece in this series of articles looking at high-dividend low-volatility funds. DIV tracks the INDXX SuperDividend U.S. Low Volatility Index. How does the composition of DIV compare to other high-dividend low-volatility funds HDLV and SPHD, and to the popular “quality” ETF DVY? Introduction High-income strategies and funds have exploded in popularity in recent years as the low-interest rate environment has prodded yield-starved investors to seek richer, and perhaps more risky, sources of income. Earlier this month, investors who sought higher yields in junk bonds and emerging market debt experienced a mini-correction as the crash in oil prices sparked fears that energy or energy-related companies (or countries!) could become insolvent. High-yielding securities can also be found within the realm of equities. Several classes of stocks have historically paid out high distributions, such as real estate investment trusts [REITs], mortgage REITs, business development companies [BDCs] and master limited partnerships [MLPs]. Similar to bonds, higher-yielding companies are often perceived to carry higher risk. In the first two articles of this series, we examined the PowerShares S&P 500 High Dividend Portfolio ETF (NYSEARCA: SPHD ) (article here ) and UBS’s ETRACS 2xLeveraged U.S. High Dividend Low Volatility ETN (NYSEARCA: HDLV ) (article here ) and compared these with each other and with popular “quality” dividend ETFs such as Vanguard Dividend Appreciation ETF (NYSEARCA: VIG ), Vanguard High Dividend Yield ETF (NYSEARCA: VYM ) and Schwab U.S. Dividend Equity ETF (NYSEARCA: SCHD ). We found that SPHD and HDLV were able to meet their dual objectives of higher dividends with lower volatility by favoring more defensive sectors such as utilities, telecommunications, and REITs. In what is likely to be the final article of this series, we will examine the Global X SuperDividend U.S. ETF (NYSEARCA: DIV ) and compare it with the other funds of its class, HDLV and SPHD. Additionally, the iShares Select Dividend ETF (NYSEARCA: DVY ) will represent a “quality” dividend ETF for comparative purposes. Global X SuperDividend U.S. ETF DIV debuted in March 2013, and tracks the INDXX SuperDividend U.S. Low Volatility Index, which was launched in February, 2008. Meanwhile, HDLV tracks the Solactive U.S. High Dividend Low Volatility Index and SPHD tracks the S&P 500 Low Volatility High Dividend Index. DVY tracks the Dow Jones U.S. Select Dividend Index. Fund details Details for the four dividend funds are shown in the table below (data from Morningstar ). Note that HDLV is a 2X leveraged ETN and the yield listed is the 2X leveraged yield. DIV HDLV SPHD DVY Yield 5.59% 9.31%* 3.30% 2.52% Payout schedule Monthly Monthly Monthly Quarterly Expense ratio 0.45% 0.85%^ 0.30% 0.39% Inception Mar 2013 Sep 2014 Oct 2012 Nov 2003 Assets $299M $28M $255 $15.7B Avg Vol. 80K 20.6K 45K 745K No. holdings 50 40 50 100 Annual turnover 20% (unknown) 47% 22% *Estimated yield from 2X the weighted average yield of constituents (4.66%). ^Does not include financing fee (LIBOR + 0.60%). DVY is one of the oldest dividend ETFs on the market. It has a massive $15.7B in assets, would be large enough to qualify it as a large-cap company. DIV, SPHD and HDLV are much smaller funds, with DIV being the largest at $299M. The liquidity for DIV is respectable, at 80K shares. DIV has a reasonable expense ratio of 0.45%, which is slightly higher than DVY’s (0.39%). SPHD has the lowest expense ratio of 0.30% while HDLV’s is the highest at 0.85% (does not include financing fee). DIV also has the highest dividend yield of 5.59% out of the four dividend funds. HDLV’s 1X yield is 4.66% while SPHD has a 3.30% yield. DVY has the lowest yield of 2.52%. Methodology The methodology for the INDXX SuperDividend U.S. Low Volatility Index is shown in the steps below (source: INDXX ). Select U.S. companies that trade on the U.S. stock exchanges that fulfill the following requirements: market cap > $500M, daily turnover > $1M, public float > 10%, beta 50% dividend cut in the previous year. MLPs and REITs are included but BDCs are excluded. Rank eligible stocks by dividend yield. The top 200 yielding companies form the “selection pool”. The 50 companies with the highest yields are chosen for inclusion into the index and are equally weighted. Every quarter, remove companies with dividend cuts or negative dividend outlooks and replace with another company in the selection pool (weightings are unchanged). Every year, reconstitute the index using the above methodology. How does this methodology compare to the other two high-dividend low-volatility ETFs? For easier comparison, I have put the data into a table. DIV HDLV SPHD Universe U.S. companies on U.S. exchanges with market cap > $500M, trading volume > $1M, public float > 10%, beta 50% dividend cut in the previous year. BDCs are excluded. Top 200 market cap names for U.S. companies on U.S. exchanges with market cap > $1B and trading volume > $15M. MLPs are excluded. S&P 500 Primary screen (yield) Select top 50 companies with the highest dividend yield Of those 200, select top 80 with the highest forward distribution yield Of those 500, select top 75 stocks with highest 12-month trailing yields, with the number of stocks from each GICS sector capped at 10 Secondary screen (volatility) (Beta Scalper1 News
Scalper1 News