Scalper1 News
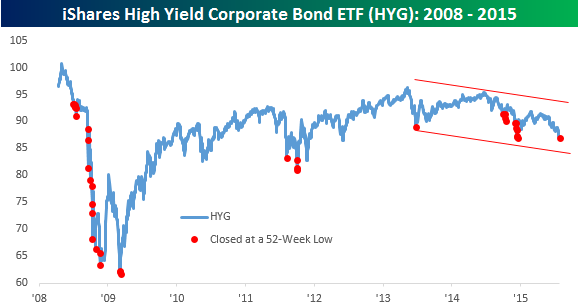
 Driven largely by renewed weakness in the energy sector and that sector’s big weighting in high yield corporates, high-yield spreads are once again widening out over the last few weeks. From a level of 465 basis points above treasuries a month ago, high yield spreads, as measured by the Merrill Lynch High Yield Master Index, have shot up to 549 bps, which is the highest level of the year. In just the last week alone, spreads have widened out by 54 bps, which is the largest 5-day move since late December. As spreads on high-yield debt have widened, prices have dropped and that has made it a rough go for holders of the high yield corporate bond ETF (NYSEARCA: HYG ). Year to date, the ETF is down over 3% not including dividends. That may not sound like much for an equity investment, but for fixed income investors, any loss of capital is an unwelcome trend. Following Monday’s decline of 0.45%, HYG closed at a new 52-week low for the first time in 2015. The chart below shows the price action in HYG going back to early 2008, and the red dots represent each time the ETF closed at a 52-week low. Yesterday’s new low was the 39th time that the ETF has traded at a new one-year low. Prior to Monday, the last time HYG traded at a 52-week low was in December when there were seven occurrences. While a bounce for HYG is certainly possible given the degree to which the ETF is now oversold, the longer term pattern doesn’t look particularly promising as it has been characterized by lower highs and lower lows ever since its bull market high in early 2013. Share this article with a colleague Scalper1 News
Scalper1 News