Scalper1 News
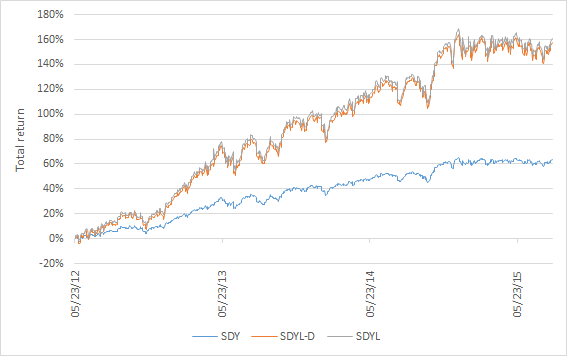
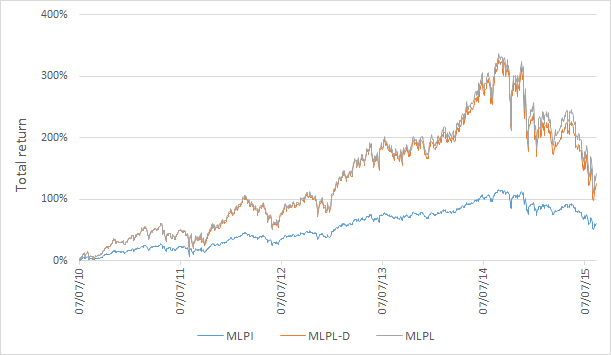
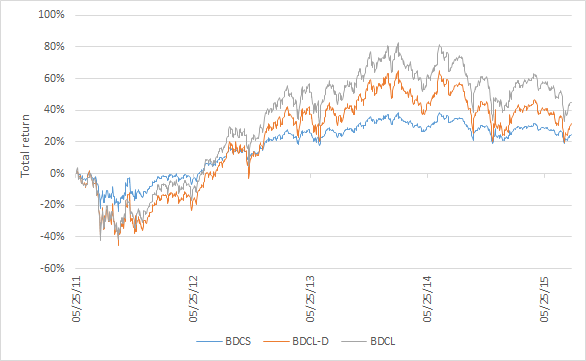
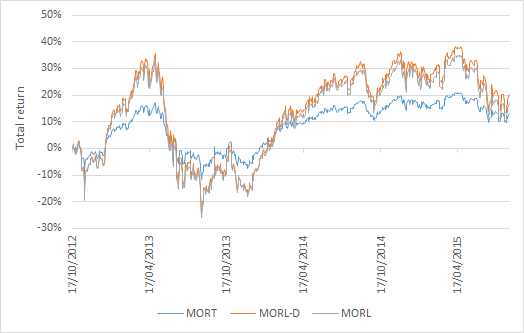
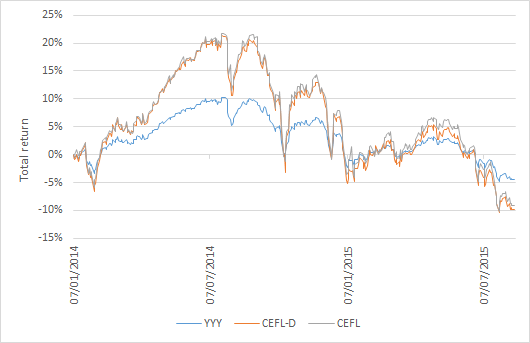 Summary The UBS ETRACS line-up of ETNs includes a number of 2x leveraged funds. The use of leverage allows the ETNs to offer higher yields, but may also increase their propensity for decay or slippage during volatile periods. The ETRACS ETNs reset their leverage monthly, has this helped or hurt their performance? Introduction The UBS (NYSE: UBS ) ETRACS line-up of ETNs cover a broad range of investment classes, including traditional equity as well as alternative investment types such as real estate investment trusts [REITs], mortgage REITs [mREITs], master limited partnerships [MLPs], business development companies [BDCs] and closed-end funds [CEFs]. A number of the ETRACS ETNs are 2x leveraged, which means that they seek to return two times the total return of the underlying index, minus fees. This allows the ETNs to offer sometimes mouth-wateringly high headline yields, making them attractive for income investors. Moreover, some of these funds offer monthly (albeit sometimes lumpy) distributions. A recent article provides an overview of the types, yields and expense ratios of these 2x leveraged ETNs. An interesting feature of the 2X leveraged ETNs is that their leverage resets monthly rather than daily, which is the norm for most leveraged funds in the market. It is well known that decay or slippage in leveraged funds will occur when the underlying index is volatile with no net change over a period of time. This “beta-slippage” has been addressed by Seeking Alpha author Fred Picard in an article entitled ” What You Need To Know About The Decay Of Leveraged ETFs “. However, by resetting monthly rather than daily, the decay of the ETRACS ETNs might be somewhat mitigated. Seeking Alpha author Dane Van Domelen has also conducted both theoretical and empirical research into the performance of leveraged funds. His research showed that in most cases, the decay is not as serious as is often initially thought to be. A subsequent article using data from 1980 to 2015 showed that monthly resetting was superior to daily resetting for a 2x leveraged version of S&P 500. This article seeks to directly address the monthly vs. daily resetting issue for a number of the ETRACS 2x leveraged ETNs. Has monthly resetting helped or hurt the ETNs compared to the equivalent daily resetting fund? Methodology The five ETNs chosen for this analysis are shown in the table below, together with their yields, inception date, volume, total expense ratio and corresponding 1x leveraged fund. For details for how the total expense ratio is calculated, please see my previous articles ( I , II ). Fund Ticker Yield Inception Volume TER* 1X Alternative Monthly Pay 2xLeveraged S&P Dividend ETN (NYSEARCA: SDYL ) 5.43% 5/2012 1.8K 1.01% SPDR Dividend ETF (NYSEARCA: SDY ) 2xMonthly Leveraged Long Alerian MLP Infrastructure Index ETN (NYSEARCA: MLPL ) 15.02% 7/2010 103K 1.16% Alerian MLP Infrastructure Index ETN (NYSEARCA: MLPI ) 2xLeveraged Long Wells Fargo Business Development Company Index ETN (NYSEARCA: BDCL ) 20.24% 5/2011 164K 1.16% Wells Fargo Business Development Company ETN (NYSEARCA: BDCS ) Monthly Pay 2xLeveraged Mortgage REIT ETN (NYSEARCA: MORL ) 26.52% 10/2012 289K 1.11% Market Vectors Mortgage REIT Income ETF (NYSEARCA: MORT ) Monthly Pay 2xLeveraged Closed-End Fund ETN (NYSEARCA: CEFL ) 22.04% 12/2013 150K 1.21% YieldShares High Income ETF (NYSEARCA: YYY ) * Includes 3-month LIBOR (currently 0.31%). Those five funds were chosen because they represent some of the more popular ETRACS ETNs, and also because they have existed for sufficient duration to be analyzed. The historical data for both the 2x and 1x leveraged funds were downloaded from Yahoo Finance . Using data for the 1x leveraged fund, I then reconstructed the price history for a hypothetically 2x leveraged fund that resets daily instead of monthly. The normalized price history for the three funds, i.e. the 1x leveraged fund, the (hypothetical) daily-reset 2x leveraged fund and the (actual) monthly-reset 2x leveraged fund are then plotted on the same graph, as shown below. SDYL The first example shown is SDYL, 2x high-dividend equity fund. Since inception in May 2012, the corresponding 1x fund SDY has returned 63.6%, while the 2x SDYL has returned 161.0%, which is over twice that of the 1x fund (the actual number is 2.53 times). This illustrates the powerful compounding of leverage that takes place when the underlying asset moves strongly in one direction with little volatility. Additionally, we observe that the hypothetical daily-resetting SDYL (SDYL-D) has a very similar price history to the actual, monthly-resetting SDYL. SDYL-D ended up with a total return of 157.4%, which is just a few percentage points lower than that of SDYL. MLPL MLPL is a 2x fund of midstream MLP companies. Since inception in Jul. 2010, the 1x fund MLPI has returned 61.0%. The 2x MLPL has returned 141.9%, while the hypothetical MLPL-D returned 125.2%. Studying the price history of these three funds is instructive. We can see that the strong bull market in MLPs from inception to Jul. 2014 provided roaring returns for both MLPL and MLPL-D. While the 1x MLPI increased by ca. 100% over this time period, and MLPL and MLPL-D returned over 300%, a quadrupling of value. This further reinforces the notion that leverage works in your favor when an asset is in a rising trend (of course, the opposite is just as true). Moreover, MLPL and MLPL-D tracked each other closely during the MLP bull market, the first four years of this chart. Then why did MLPD-D return some 15% less than MLPL since inception? The answer lies in the fifth and final year of this chart, a period of extremely volatility in oil and oil-related stocks. During this period, we see divergence between the two 2x funds, with the monthly-resetting MLPL falling less than the daily-resetting MLPL-D during this time. This seems to support the conventional wisdom that monthly-resetting is superior to daily-resetting during bouts of heightened volatility. BDCL BDCL is a 2x fund of BDCs. BDCL’s inception took place at an unfortunate time, in the midst of the Eurozone debt crisis. BDCL dropped over 40% from its inception in May 2011 before rebounding. Since inception, the 1x BDCS returned 24.6% and the 2x BDCL returned 45.1%, which is slightly less than twice that of the 1x fund. This illustrates the negative effect that leverage has when the underlying asset moves strongly in one direction, and then reverses. To further highlight this, consider the fact that when BDCS (blue line in chart) breaks even in early 2012, BDCL is still approximately 10% below its inception price. While BDCL fared less well than expected, the daily-resetting BDCL-D did even worse. It returned only 31.3% since inception, significantly underperforming BDCL at 45.1%. This further reinforces the notion that monthly-resetting is advantageous when the underlying asset is volatile. MORL MORL owns a 2x leveraged basket of mREITs. Since inception in Oct. 2012, the 1x MORT has returned 13.0% while the 2x MORL has returned 16.7%, which is far lower than twice of the 1x fund. This indicates that like BDCL, MORL has performed worse than expected. As can be seen from the above chart, this can be attributed to the large price swings experienced by the underlying asset, causing leverage to work against the 2x funds. Very surprisingly, however, the hypothetical daily-reset MORL-D (20.10%) actually outperformed MORL. This contradicts the earlier notion that daily resetting is inferior to monthly resetting during volatile periods. The reason for this result is currently unclear to me. CEFL The final fund to be analyzed is CEFL, a fund-of-CEFs. Since inception in Dec. 2013, the 1x YYY has returned -4.5% while the 2x CEFL has returned approximately twice that, at -9.1%. Interestingly, and unlike MORL, the price swings in CEFL did not appear to adversely affect its total return performance. However, this could also be due to CEFL’s shorter history compared to MORL. The hypothetical daily-reset CEFL-D performed only slightly worse than CEFL, at -9.9%. However, this difference is too small for any meaningful conclusions to be drawn for this fund. Conclusion In his article , Dane Van Domelen wrote: In theory, it’s hard to say whether a 2x daily or 2x monthly leveraged ETF should perform better. During steady index growth or decline, daily is better; during volatile periods for the index with little or no net change, monthly is better. The results of this study partially agree with Dane’s conclusion, but also suggest that the real situation, empirically at least, may be a bit more complicated. Analysis of these five 2x monthly-reset ETNs and their hypothetical daily-reset counterparts revealed that: There was no significant difference in performance between monthly and daily resets when the asset was in a steady upward trend, as was the case for SDYL and the first four years of MLPL. MLPL outperformed the daily-reset MLPL-D during the most recent 1-year period, in which the asset tumbled and with high volatility. For the more volatile ETNs, namely BDCL, MORL, and CEFL, the results were mixed. BDCL significantly outperformed BDCL-D over four years, while MORL underperformed MORL-D over three years. CEFL and CEFL-D had comparable results over two years. Overall, four out of five of the monthly-reset ETNs outperformed their daily-reset counterparts, although the differences were often small: SDYL (161.0% vs. 157.4% for SDYL-D), MLPL (141.9% vs. 125.2%), BDCL (45.1% vs. 31.3%) and CEFL (-9.1% vs. -9.9%). The only underperforming monthly-reset ETN was MORL (16.7% vs. 20.1%). The average differential for the 5 ETNs was +6.3%. In summary, with regards to the question posed in the title, “Has Monthly Resetting Helped Or Hurt The ETRACS 2x Leveraged ETNs?”, I would have to say that the jury is still out. I am slightly leaning towards the “helped” side however. This article used mainly empirical and reconstructed data, so I am also interested to hear if any of the more mathematically-inclined investors would be able to provide a more theoretical framework for the monthly vs. daily resetting issue. Disclosure: I/we have no positions in any stocks mentioned, and no plans to initiate any positions within the next 72 hours. (More…) I wrote this article myself, and it expresses my own opinions. I am not receiving compensation for it (other than from Seeking Alpha). I have no business relationship with any company whose stock is mentioned in this article. Scalper1 News
Scalper1 News