Scalper1 News
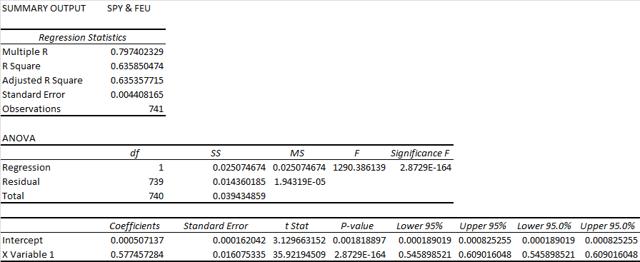
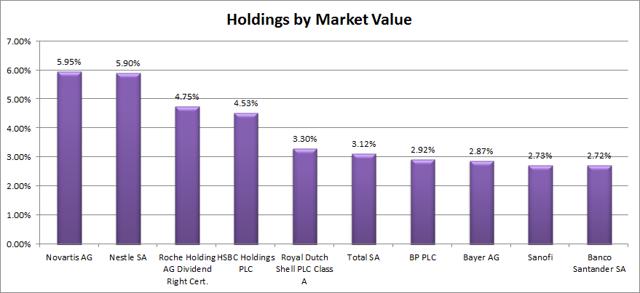 Summary I’m taking a look at FEU as a candidate for inclusion in my ETF portfolio. The correlation with SPY isn’t bad, and the overall risk level for a portfolio seems respectable. The expense ratio is a little bit high and the diversification is weak. I’ll keep FEU on the list as a possibility. I’m not assessing any tax impacts. Investors should check their own situation for tax exposure. Investors should be seeking to improve their risk adjusted returns. I’m a big fan of using ETFs to achieve the risk adjusted returns relative to the portfolios that a normal investor can generate for themselves after trading costs. I’m working on building a new portfolio and I’m going to be analyzing several of the ETFs that I am considering for my personal portfolio. One of the funds that I’m considering is the SPDR STOXX Europe 50 ETF (NYSEARCA: FEU ). I’ll be performing a substantial portion of my analysis along the lines of modern portfolio theory, so my goal is to find ways to minimize costs while achieving diversification to reduce my risk level. What does FEU do? FEU attempts to provide results which are comparable (before fees and expenses) to the total return of the STOXX Europe 50 Index. FEU falls under the category of “Europe Stock.” Does FEU provide diversification benefits to a portfolio? Each investor may hold a different portfolio, but I use the SPDR S&P 500 Trust ETF (NYSEARCA: SPY ) as the basis for my analysis. I believe SPY, or another large cap U.S. fund with similar properties, represents the reasonable first step for many investors designing an ETF portfolio. Therefore, I start my diversification analysis by seeing how it works with SPY. I start with an ANOVA table: (click to enlarge) The correlation is about 80%, which is great for Modern Portfolio Theory. The lower correlation makes it much easier to mix the ETF into a portfolio and take advantage of the benefits of diversification. My goal is risk adjusted returns, and my method is minimizing risk. Standard deviation of daily returns (dividend adjusted, measured since January 2012) The standard deviation is moderately high, but not terrible. For FEU it is 1.0080%. For SPY, it is 0.7300% for the same period. SPY usually beats other ETFs in this regard, and the low correlation with SPY makes the higher standard deviation acceptable. So far, the ETF is look fairly solid in my first pass. Mixing it with SPY I also run comparisons on the standard deviation of daily returns for the portfolio assuming that the portfolio is combined with the S&P 500. For research, I assume daily rebalancing because it dramatically simplifies the math. With a 50/50 weighting in a portfolio holding only SPY and FEU, the standard deviation of daily returns across the entire portfolio is 0.8250%. If an investor wanted to use FEU as a supplement to their portfolio, the standard deviation across the portfolio with 95% in SPY and 5% in FEU would have been .7343%. In my opinion, the standard deviation across the portfolio looks fine with a moderate position in FEU. In my opinion, a reasonable exposure based on the deviation is probably in the 5 to 10% range. Anything over 20% gets too risky. Average Volume The average volume was recently around 65,000 shares per day. That isn’t high, but it is enough that I would be comfortable holding the shares and believe the liquidity was good enough for the statistical values for correlation to be reliable. Why I use standard deviation of daily returns I don’t believe historical returns have predictive power for future returns, but I do believe historical values for standard deviations of returns relative to other ETFs have some predictive power on future risks and correlations. Yield & Taxes The distribution yield is 5.40%. The SEC yield is 2.64%. That’s a fairly strong yield, though I’d caution investors to research the source of the yields and the tax implications for their individual situation. I’m not a CPA or CFP, so I’m not assessing any tax impacts. Expense Ratio The ETF is posting .29% for an expense ratio. I want diversification, I want stability, and I don’t want to pay for them. The expense ratio on this fund is higher than I want to pay for an equity fund, but it isn’t enough to disqualify the ETF from consideration. Market to NAV The ETF is at a .81% premium to NAV currently. Premiums or discounts to NAV can change very quickly so investors should check prior to putting in an order. I wouldn’t want to pay a premium greater than .1% when investing in an ETF, unless I could find a solid accounting reason for the premium to exist. I certainly won’t be paying a .81% premium to buy into FEU without finding a solid reason for the premium. Largest Holdings The diversification is fairly weak. Given that the name included “Europe 50,” investors should expect the diversification to be weak. However, modern portfolio theory still says the overall level of risk introduced to the portfolio through a small to moderate position (5 to 10%) is acceptable. (click to enlarge) Conclusion I’m currently screening a large volume of ETFs for my own portfolio. The portfolio I’m building is through Schwab, so I’m able to trade FEU with no commissions. I have a strong preference for researching ETFs that are free to trade in my account, so most of my research will be on ETFs that fall under the “ETF OneSource” program. I’ll keep FEU on my list as a possibility for exposure to Europe as part of my international diversification. If I entered into a position in FEU it would be with a limit order that refused to pay the premium to NAV. Since the NAV could change suddenly, I’d have to do single day limit orders to reduce my risk of paying more than NAV. Additional disclosure: Information in this article represents the opinion of the analyst. All statements are represented as opinions, rather than facts, and should not be construed as advice to buy or sell a security. Ratings of “outperform” and “underperform” reflect the analyst’s estimation of a divergence between the market value for a security and the price that would be appropriate given the potential for risks and returns relative to other securities. The analyst does not know your particular objectives for returns or constraints upon investing. All investors are encouraged to do their own research before making any investment decision. Information is regularly obtained from Yahoo Finance, Google Finance, and SEC Database. If Yahoo, Google, or the SEC database contained faulty or old information it could be incorporated into my analysis. The analyst holds a diversified portfolio including mutual funds or index funds which may include a small long exposure to the stock. Scalper1 News
Scalper1 News