Scalper1 News
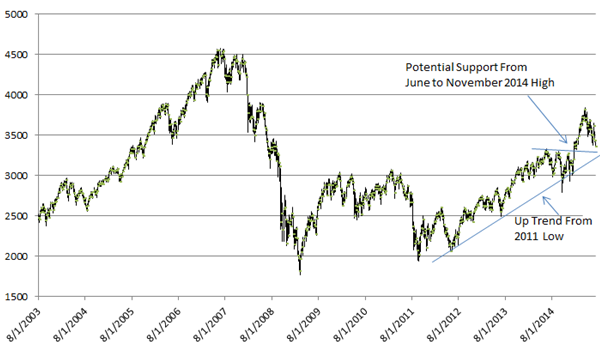
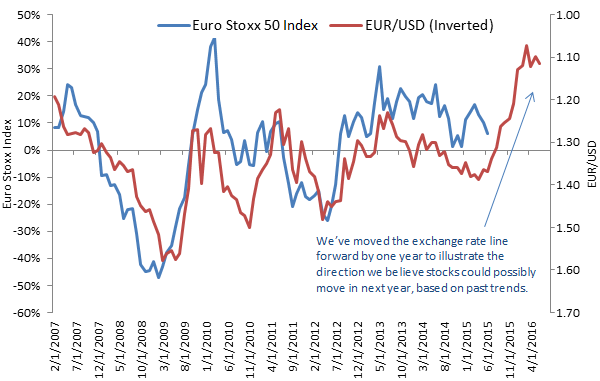
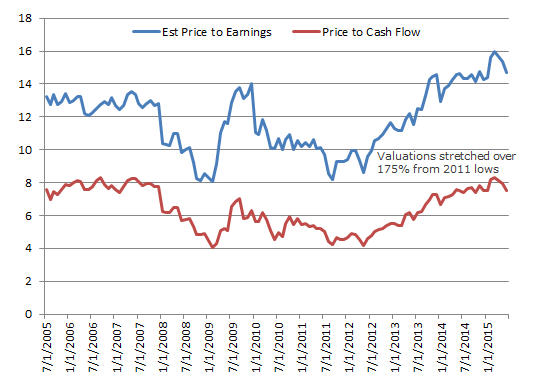
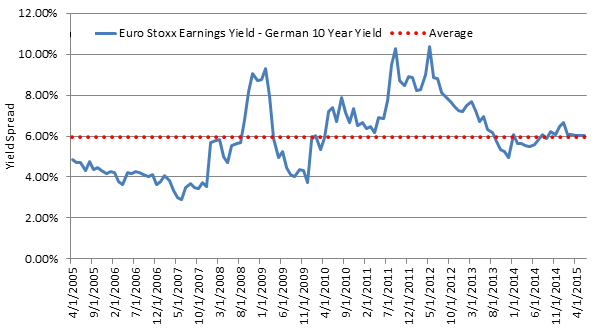 Summary With the eurozone accounting for 17% of the world’s GDP, I believe globally minded investors clearly need to contemplate a strategic allocation to this region. I believe a volatility-managed solution may be a sensible approach for investors to gain exposure to this critical region. In addition, I believe the divergent monetary policy between the ECB and the Fed emphasizes the need for investors to consider a currency hedge to mitigate foreign exchange risk. A currency-hedged low volatility approach could help investors pursue the region’s upside potential while managing risk By John G. Feyerer, Vice President, Director of Equity ETF Product Strategy, Invesco PowerShares Capital Management LLC The never-ending Greek tragedy continues to take twists and turns as the news surrounding Greece’s fate in the European Economic and Monetary Union (EMU) seems to change minute to minute. This saga has and will likely continue to result in greater volatility in equity markets, yet could also provide potential buying opportunities for European stocks as the dust settles. As pundits opine on the likelihood of various outcomes from the current crisis, I believe investors should step back and evaluate the longer-term opportunity to invest in the eurozone. Eurozone economic indicators point to continued expansion… With the eurozone accounting for 17% of the world’s GDP 1 , I believe globally minded investors clearly need to contemplate a strategic allocation to this region. Trends in the major economic indicators point to continued expansion, which should bode well for equity performance in Europe. Business activity in the 19-member bloc expanded at its fastest pace in four years in June, as measured by the Markit Composite Purchasing Managers’ Index (PMI), which tracks manufacturing and service sector equities The indicator rose to 54.2 (from 53.6 in May), representing continued solid footing above the 50 mark that divides expansion and contraction. 2 PMI data from Europe’s two biggest economies – Germany and France – also painted a bright outlook for the eurozone economy. The survey also indicated that employment and new orders had risen at the strongest rates in four years over the second quarter, although growth slowed in both cases in the month of June as concern over the re-emergence of the Greek debt crisis surfaced yet again. … While technicals are still supportive Eurozone stock prices, as measured by the Euro Stoxx 50 Index, maintained levels of support across the previous highs established in June 2014 and November 2014 – between 3,275 and 3,375, as seen below. In addition, the chart illustrates that the Euro Stoxx 50 Index is still firmly in the uptrend established in September 2011, while still 25% off the market highs established prior to the global financial crisis. European stocks are in an uptrend, but still off of market highs Euro Stoxx 50 Index high, low and closing values from Aug. 1, 2003, to July 6, 2015 Source: Bloomberg L.P. as of July 6, 2015. Past Performance is not a guarantee of future results. Investments cannot be made directly into an index. Additional tailwind courtesy of the weak euro? The 17% drop 3 in the value of the euro relative to the US dollar since June 30, 2014, coupled with the tremendous run-up in European equities earlier this year, begs the question: Where do eurozone equities go from here? Historically, the year-over-year change in the EUR/USD exchange rate has led the direction of the Euro Stoxx 50 Index by approximately one year. Therefore, euro weakness in the past portends continued upside for eurozone equities, in my view. The chart below illustrates the strong correlation between movements in the EUR/USD exchange rate and the region’s subsequent one-year stock market performance. As described above, the strong PMI levels should augur strong earnings growth, which would support continued appreciation of equities within the eurozone. Correlations have historically been strong between movements in the EUR/USD exchange rate and the region’s subsequent one-year stock market performance Euro Stoxx 50 Index year over year vs. EUR/USD exchange rate plus one year. Note that we’ve inverted the exchange rate line to more clearly illustrate the trends in movement. In reality, downward movements in the exchange rate have tended to precede upward movements in stocks, and vice versa. Source: Bloomberg L.P. as of June 30, 2015. Past Performance is not a guarantee of future results. Investments cannot be made directly into an index. Projections shown are based on the past trends shown in this graphic and are the opinion of the author. There is no guarantee that the projections shown will come to pass. Elevated eurozone valuations highlight potential risk While economic indicators, stock market technicals and the tailwind from the weak euro point to potential continued upside in the eurozone, an analysis of equity valuations underscores the potential risks. Using the Euro Stoxx 50 Index, the chart below illustrates the degree to which valuations are being stretched. Regardless of the metric used (and many were reviewed), the nearly 100% run-up in the eurozone since the September 2011 low has resulted in valuations that despite recent volatility related to the referendum in Greece, are approaching, or have surpassed, decade-long highs. Eurozone equity valuations are approaching or have surpassed decade-long highs Euro Stoxx 50 Index estimated price-earnings (P/E) and price to cash flow Source: Bloomberg L.P. as of June 30, 2015. Past performance is not a guarantee of future results. In addition, since the launch of the EMU’s 60 billion euro a month quantitative easing (QE) program in March 2015, it is instructive to look at the relationship between the Euro Stoxx 50 Index earnings yield relative to the German government 10-year yield to understand the current relative valuation between stocks and bonds in the region. This is shown in the chart below. The current reading reveals that, unlike in the US, eurozone stocks do not appear at this point to be inexpensive relative to bonds, given that the yield spread is near the middle of the range observed since 2005. QE has helped depress German bond yields, but hasn’t thus far resulted in a material difference between the historical relationship between earnings yield and the 10-year German government bond yield. This is due to the fact that stock prices have rallied sharply in recent years, as investors have looked to take advantage of the favorable economic outlook. Eurozone stocks do not appear inexpensive relative to bonds Euro Stoxx 50 Index estimated earnings yield relative to German government 10-year bond yields Source: Bloomberg L.P. as of June 30, 2015. Past performance is not a guarantee of future results. Investments cannot be made directly into an index. Managing volatility amidst eurozone opportunity and uncertainty Given the potential upside of equity exposure to the eurozone (for reasons outlined above), the risk associated with the rise in valuation levels and the ongoing uncertainty associated with a potential Greek exit from the eurozone (or “Grexit”), I believe a volatility-managed solution may be a sensible approach for investors to gain exposure to this critical region. In addition, I believe the divergent monetary policy between the European Central Bank and the Federal Reserve highlights the downside risk to the value of the euro and emphasizes the need for investors to consider a currency hedge to mitigate the foreign exchange risk. A currency-hedged low volatility approach provides investors the opportunity to participate in the upside in the face of stretching valuations and exchange rate risk, as well as a downside risk mitigation smart beta strategy. PowerShares Europe Currency Hedged Low Volatility Portfolio PowerShares has introduced the first ETF offering a currency-hedged low volatility approach to Europe – the PowerShares Europe Currency Hedged Low Volatility Portfolio (NYSEARCA: FXEU ). FXEU provides exposure to the S&P Eurozone Low Volatility USD Hedged Index, which is composed of the 80 least volatile stocks in the S&P Eurozone BMI. Index holdings are currency hedged to the US dollar using rolling one-month forward contracts that are adjusted monthly. The ETF and index constituents are reconstituted quarterly. Constituents are weighted relative to the inverse of the trailing 12-month realized volatility, with the least volatile stocks receiving the highest weights. Learn more about FXEU 1 Source: WorldBank, as of December 2013 – report printed December 2014 2 Source: Markit Economics press release July 3, 2015 3 Source: Bloomberg L.P. as of June 30, 2015 Important information Markit Composite Purchasing Managers’ Index (PMI), a commonly cited indictor of the manufacturing sectors’ economic health, is calculated by the Institute of Supply Management. Price-earnings (P/E) ratio, also called multiple, measures a stock’s valuation by dividing its share price by its earnings per share. Price-to-cash-flow ratio is a stock’s capitalization divided by its cash for the fiscal year. Yield spread is the difference between yields on differing debt instruments, calculated by deducting the yield of one instrument from another. Earnings refer to the amount of profit a company produces during a specific period, typically usually a calendar quarter or year. Valuation is how the market measures the worth of a company or investment. S&P Eurozone BMI is a comprehensive benchmark that includes large, mid, and small caps from developed and emerging Eurozone countries. It is a regional subindex of the S&P Global BMI. The Euro Stoxx 50 Index measures the performance of blue-chip eurozone equities. Valuation is how the market measures the worth of a company or investment. There are risks involved with investing in ETFs, including possible loss of money. Shares are not actively managed and are subject to risks similar to those of stocks, including those regarding short selling and margin maintenance requirements. Ordinary brokerage commissions apply. The Fund’s return may not match the return of the Underlying Index. The Fund is subject to certain other risks. Please see the current prospectus for more information regarding the risk associated with an investment in the Fund. The risks of investing in securities of foreign issuers, including emerging market issuers, can include fluctuations in foreign currencies, political and economic instability, and foreign taxation issues. The Fund may invest in foreign markets and because foreign exchanges may be open on days when the Fund does not price its shares, the value of the non-US securities in the Fund’s portfolio my change on days when you will not be able to purchase or sell your shares. The dollar value of foreign investments will be affected by changes in the exchange rates between the dollar and the currencies in which those investments are traded. Investments focused in a particular industry or sector are subject to greater risk, and are more greatly impacted by market volatility, than more diversified investments. Derivatives may be more volatile and less liquid than traditional investments and are subject to market, interest rate, credit, leverage, counterparty and management risks. An investment in a derivative could lose more than the cash amount invested. Currency hedging can reduce or eliminate losses or gains and can also be subject to imperfect matching between the derivative and its reference asset. There is no assurance the Fund’s hedging strategy will be effective. Some foreign currency forward contracts are less liquid, which may result in the Fund being unable to structure its hedging transactions as intended and may be unable to obtain sufficient liquidity in an underlying currency. As a result, the Fund’s hedging transactions may not successfully reduce the currency risk included in the Fund’s portfolio. The Fund’s investments in futures contracts will cause it to be deemed to be a commodity pool, subjecting it to regulation under the Commodity Exchange Act and Commodity Futures Trading Commission (CFTC) rules. The Adviser, a registered Commodity Pool Operator (CPO), and the Fund will be operated in accordance with CFTC rules. Registration as a CPO subjects the registrant to additional laws, regulations and enforcement policies; all of which could increase compliance costs, affect the operations and financial performance of funds whose adviser is registered as a CPO. Registration as a commodity pool may have negative effects on the ability of the Fund to engage in its planned investment program. Many countries in the European Union are susceptible to high economic risks associated with high levels of debt, notably due to investments in sovereign debts of European countries such as Greece, Italy and Spain. The Fund may hold illiquid securities that it may be unable to sell at the preferred time or price and could lose its entire investment in such securities. The Fund is non-diversified and may experience greater volatility than a more diversified investment. There is no assurance that the Fund will provide low volatility. The information provided is for educational purposes only and does not constitute a recommendation of the suitability of any investment strategy for a particular investor. Invesco does not provide tax advice. The tax information contained herein is general and is not exhaustive by nature. Federal and state tax laws are complex and constantly changing. Investors should always consult their own legal or tax professional for information concerning their individual situation. The opinions expressed are those of the authors, are based on current market conditions and are subject to change without notice. These opinions may differ from those of other Invesco investment professionals. Before investing, investors should carefully read the prospectus/summary prospectus and carefully consider the investment objectives, risks, charges and expenses. For this and more complete information about the Funds call 800 983 0903 or visit invescopowershares.com for prospectus/summary prospectus. NOT FDIC INSURED MAY LOSE VALUE NO BANK GUARANTEE All data provided by Invesco unless otherwise noted. Invesco Distributors, Inc. is the US distributor for Invesco Ltd.’s retail products and collective trust funds. Invesco Advisers, Inc. and other affiliated investment advisers mentioned provide investment advisory services and do not sell securities. Invesco Unit Investment Trusts are distributed by the sponsor, Invesco Capital Markets, Inc., and broker-dealers including Invesco Distributors, Inc. PowerShares® is a registered trademark of Invesco PowerShares Capital Management LLC (Invesco PowerShares). Each entity is an indirect, wholly owned subsidiary of Invesco Ltd. ©2015 Invesco Ltd. All rights reserved. Evaluating opportunity in the eurozone when Greece is (yet again) the word by Invesco Blog. Scalper1 News
Scalper1 News