Scalper1 News
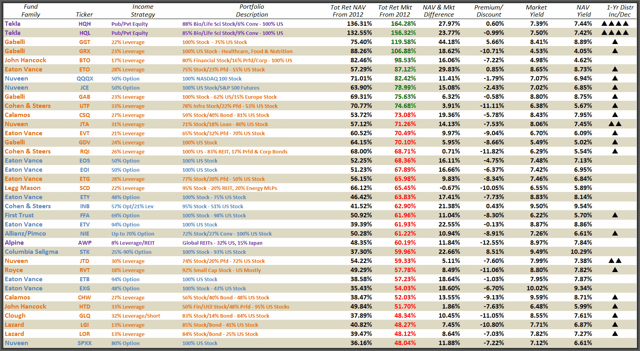
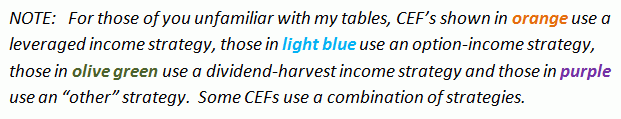
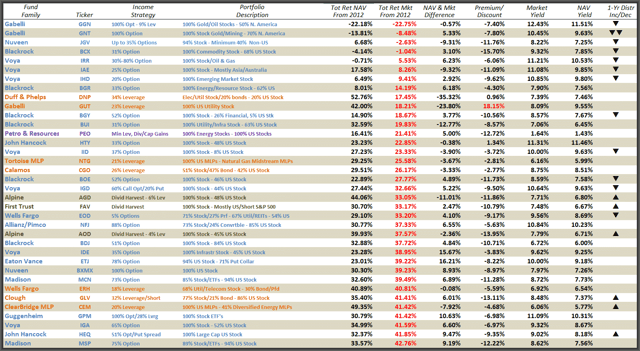
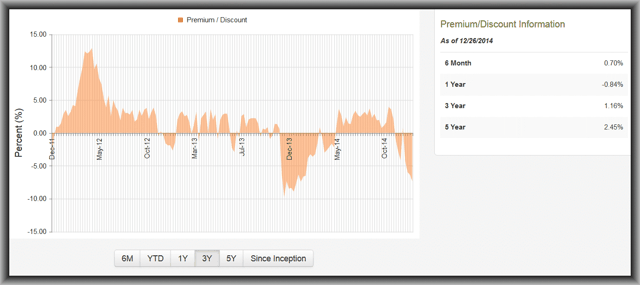 Summary The bull market in US equities over the past 3-years has certainly been a boon to most equity CEFs though it all depended on what funds you were in. Equity CEFs that focused in healthcare, biotech or technology have been the greatest beneficiaries while commodity funds in energy, gold and metals have lagged the most. But could 2015 shape up to be a rotational year? If a more aggressive Federal Reserve and a reasonably strong global economy are at hand, than maybe so. A lot of my followers have asked why I am not writing as many articles as I used to. Part of the reason is that I don’t see as many opportunities in equity based CEFs as in years past and part of the reason is that as my investment advisory business has grown, I’ve had to dedicate more time to clients and less time to writing articles. But that’s not to say that I am following equity CEFs any less than I used to so before I go into my picks for 2015, let’s take a look back at how funds in my CEF universe have performed over the last 3-years since sometimes the best funds to pick going forward are the same ones that have performed well in the past. On the other hand, what has worked over the last one to three years has been so lopsided, so extreme compared to what hasn’t, that it probably makes sense to bottom fish for funds that could see rotational assets. The 3-Year Winner And Loser Lists The mostly uninterrupted ramp-up bull market in US equities really got started towards the end of 2011 so shown below are the best performing equity based CEFs I follow based on their total return market price performance since 2012. Note: Total return means all distributions are added back but not on a reinvested basis . I follow about 100 equity CEFs out of about 250 available and the ones I follow generally include the largest and the most liquid funds as well as the ones with the highest yields. I don’t follow country specific CEFs and I include only a few of the largest and most popular funds to represent the REIT and MLP specific CEFs. So with that said, here are the top 35 equity CEFs that I can show in a screen shot out of about the 100 that I follow. Funds shown in green have outperformed the S&P 500 over the past 3-years and those shown in red have underperformed. Note: the S&P 500, as represented by the popular SPDR S&P 500 Trust (NYSEARCA: SPY ) is up 74.3% since 2012 including quarterly dividends however most quoted S&P 500 returns do not include distributions and thus the S&P 500 would be up a more modest 66.1%. (click to enlarge) As you can see, it has been difficult for most equity CEFs to outperform the S&P 500 not just on a market price basis but also on an NAV price basis (column to the left of the Tot Ret Mkt column above). Though I place a lot more precedence on a fund’s NAV total return performance since that is the true performance of a fund to compare against its benchmarks, I realize that investors want to know what their actual return would be and so I have sorted the funds by their total return market price performance. Now there are reasons why most equity CEFs won’t outperform the S&P 500 during a bull market period. The biggest reason is that most equity CEFs list income as their primary objective with appreciation as a secondary objective. So for funds that use a defensive covered call write option strategy ( light blue above ) or include fixed-income securities ( most leveraged CEFs shown in orange ) or include international securities ( can be any income strategy shown above ), they generally won’t be able to keep pace with the S&P 500 when the US stock market averages run away from just about any other asset class around the globe. In fact, most of the equity CEFs that have outperformed the S&P 500 over the last 3-years are either the pure equity leveraged funds (mostly from Gabelli ) or funds that focus in sectors that have outperformed the S&P 500, such as healthcare and technology. Let’s now turn the table upside down and show you the bottom 35 or so equity CEFs I follow that have underperformed the S&P 500 the most. (click to enlarge) Here you can see that the funds lagging the worst in market price performance over the last 3-years are generally in the commodity sectors such as oil, gold and metals though funds that have a large percentage of their stock portfolio overseas also show up. So what can this tell us about what funds to own going forward into 2015? Well, I don’t try and make market predictions but I can certainly tell you what funds I am buying based on valuations as well as seasonal trends. So let’s get started. Equity CEFs For A Sector Rotation One could make a good argument that we will see a sector rotation that should, at least initially, help some of the CEF underperformers over years past. This tends to happen at the beginning of a new year and 2015 may actually see a more sustainable rotation if a rise in interest rates start to gain traction in response to a stronger global economy and a more hawkish Federal Reserve . If that happens, then funds like the Gabelli (GAMCO) Global Gold, Natural Resource and Income Trust (NYSEMKT: GGN ) , $6.76 market price, $7.30 NAV, -7.4% discount, 12.4% current market yield , and the Gabelli Natural Resources, Gold and Income Trust (NYSE: GNT ) , $8.04 market price, $8.72 NAV, -7.8% discount, 10.4% current market yield , should be in position to take advantage of that. Though I have mentioned GGN and GNT in past articles, I haven’t actually gone out on a limb and recommended them but there are reasons why I am doing so now. Both GGN and GNT have a lot in common beginning with their top holdings which are mostly gold and gold mining stocks (about 50% of portfolio) along with energy and energy service stocks (about 30% to 35% of portfolio). Both funds use an option income strategy writing both call options and to a lesser extent, put options on their individual stock holdings. This income strategy can generate a lot of income for the funds but can also work against them if their mostly gold and energy stock portfolios become too volatile, which is what we are seeing here late in the year. The major difference between the two funds is that GGN uses leverage and GNT also includes about 15% of its portfolio in other commodity sectors. In other words, both of these funds invest in some of the worst sectors you could possibly be in this year. What tends to happen to poor performing CEFs at year end, especially when other market sectors have performed well, is that tax-loss selling will drive their market price valuations to wider and wider discounts. For particularly volatile CEFs like GGN and GNT, this can become even more extreme. Here is GNT’s 3-year Premium/Discount chart where you can see the fund’s valuation tends to spike one direction at the end of the year only to reverse course and head the opposite direction at the beginning of the year. (click to enlarge) And here is GGN’s 3-year Premium/Discount chart showing much of the same reversal at year end. Note: each tick in the charts represents one week. (click to enlarge) Of course, any sustained move back up for GGN and GNT will depend on the gold and energy markets showing some turnaround strength, resulting in a more definitive rotation into these sectors. Keep in mind that GAMCO recently lowered both fund’s distributions from $0.09/share per month to $0.07/share per month beginning in January, 2015. That should take some pressure off the funds to cover their distributions while still offering an incredibly generous 12.4% current market yield for GGN and a 10.4% current market yield for GNT. Also keep in mind that as option-income CEFs, GGN’s and GNT’s NAVs have actually been more defensive than say, the SPDR Gold Shares ETF (NYSEARCA: GLD ) . Over the last 3-years, GGN’s NAV total return may be down a depressing -22.2% and GNT’s NAV is down -13.8% but compared to the most popular gold ETF, GLD is down a whopping -32.4%. Of course, CEF market prices can go wherever investors take them and that is where you will find opportunities in these funds when they stray too far from their NAVs. GGN and GNT may not be appropriate for income only investors despite their generous yields as they can be quite volatile, but if history is any guide, we could see a bounce in these funds at the beginning of the year even if it is only temporary. Equity CEFs For A Continued Strong Market You don’t have to go all in to the commodity sector to find funds that are undervalued. Going back to the best performers table above, there are a number of diversified funds that will give you exposure to a variety of sectors but yet continue to trade at heavy discounts. My favorite diversified funds are the Legg Mason Capital & Income fund (NYSE: SCD ) , $17.09 market price, $19.00 NAV, -10.1% discount, 6.6% current market yield , and the Cohen & Steers Infrastructure fund (NYSE: UTF ) , $23.20 market price, $26.10 NAV, -11.1% discount, 6.4% current market yield . Both of these funds use leverage and can also be quite volatile, but their diversified portfolios in income sectors such as energy MLPs, utilities, REITs and infrastructure stocks as well as fixed-income securities such as preferreds or convertibles, makes them very insulated from any one sector underperforming. Both fund sponsors have done an excellent job in overweighting the best performing sectors while lowering exposure in underperforming sectors. The other reason why I like both funds in a continued strong market environment is that based on their superior NAV performances over the past 3-years, both funds I feel are overdue for distribution increases. This should help narrow UTF’s and SCD’s wide double digit discounts which, compared to other equity CEFs that don’t have near the total return performances, continue to trade at ridiculously low valuations. Other Equity CEFs I Like For 2015 Energy MLP CEFs have come under intense pressure ever since the fallout in oil prices. This is another sector that should also benefit with any rotation back to energy stocks due to higher oil prices. I don’t necessarily have any favorites in this group since like the municipal bond CEF sector that I recommended in mid to late 2013, all of these funds tend to move up or down together. To get a list of energy MLP CEFs available to investors, go to this link, CEFConnect , and under the US Equity tab pull down menu, check the box marked MLP. If you are looking for more CEF investment ideas, I would suggest reading my article from late October, Funds To Buy And Sell Heading Into 2015 . In that article, I also reiterate the case for one of my all-time favorite funds, the Gabelli Healthcare & WellnessRX fund (NYSE: GRX ) , $10.59 market price, $11.86 NAV, -10.7% discount , 4.5% current yield as well as the Eaton Vance Tax-Advantaged Dividend Income fund (NYSE: EVT ) , $20.74 market price, $22.80 NAV, -9.0% discount , 6.7% current yield . Both funds have moved up nicely since I wrote that article even after multiple ordinary and capital gain distributions, but I also think both funds have performed so well this year that we may see another distribution increase for both by the end of the 1st quarter. Conclusion Finally, I hope all of my readers took my advice on the Nuveen equity option CEF restructurings and stuck it out with the merger between the Nuveen NASDAQ Premium Income & Growth fund (NASDAQ: QQQX ) and the Nuveen Equity Premium Advantage fund (JLA) , which closed last week at a 0.70225331 conversion ratio, to be exact. Because if you had held onto your JLA shares and even added as I suggested during periods when the arbitrage spread widened, you would have seen your JLA shares converted to QQQX shares at a nice bump up in valuation, not just from when the restructurings and mergers were first announced on May 1st but even as recently as several weeks ago. I wrote multiple articles and blogs during this tumultuous period when at times, it looked like the restructurings might not go forward due to shareholder apathy. But Nuveen ultimately got approval on all of the restructurings and today, all of the old Nuveen equity option CEFs cease to exist as they have all either merged or been renamed. This is rather sad for me since I had a long and rewarding relationship with these funds. Back in late 2007, I convinced Nuveen to drop the “buy-put” component of a collar option strategy ( sell call AND buy put ) that JSN, JPZ and JLA used at the time. I realized the funds received no valuation benefit from investors as “risk-adjusted” funds even during difficult market periods and during strong market periods, their uber defensive collar option strategy severely limited NAV growth. So it made sense to drop the added expense of buying put options and ultimately, that’s what Nuveen did. Fast forward to today and I can’t help but wonder at a time when even more equity CEFs are restructuring and dropping their defensive guards that this may be the time in which they are needed the most. Scalper1 News
Scalper1 News