Scalper1 News
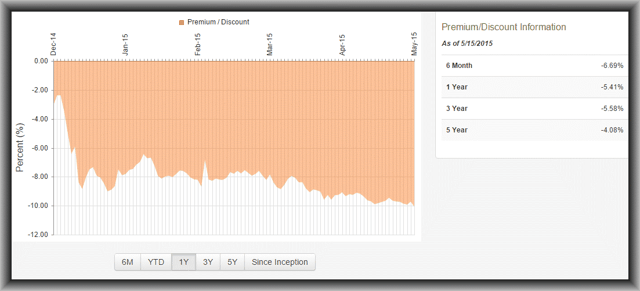
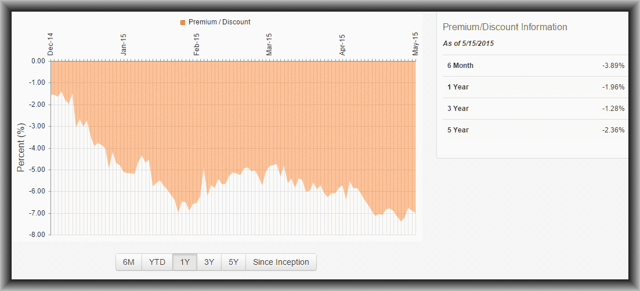 Summary The Dow Jones Industrial Average (DJIA) is a simple index to correlate to as it only has 30 stock components. So what if I told you you could buy the DJIA at a -10% discount, receive a 6.9% yield and be even more defensive than the DJIA itself? Sound too good to be true? Well, that’s exactly what you can get in the new Nuveen Dow 30 Dynamic Overwrite CEF (DIAX). Index investing has long been looked upon as a simple yet effective way to get broad market exposure without having to do a lot of research. Over the last several years, index investing, particularly in funds that correlate to the major US market indices, such as the S&P 500, the Dow Jones Industrial Average and the NASDAQ-100, have been even more rewarding as the performance of these indices has run away from the vast majority of actively managed portfolios and mutual funds. So knowing the performance and popularity of index investing and how difficult it is to beat the major US based stock indices, who wouldn’t want to buy these indices at a wide discount? Say for example, I told you you could buy the equivalent of the Dow Jones Industrial Average at a -10% discount. Would you be interested? That would be like being magically transported back to the fall of last year when the markets were going through a 10% correction and the DJIA was trading in the 16,000’s rather than the 18,000’s today. Then let me tell you that not only could you buy all of the Dow 30 components at essentially -10% off their current price, I will also throw in an enhanced yield of 6.9%, significantly higher than the most popular ETF that correlates to the DJIA, the SPDR Dow Jones Industrial Average fund (NYSEARCA: DIA ) , which yields only 2.0%. And finally, what if I told you that you could also receive some downside protection if you thought the markets may have seen their best days and returns may be much more modest going forward. Probably a safe bet. In other words, if the markets flatten out or even go through a difficult period, this investment’s net asset value will actually outperform the DJIA. Well, guess what? There is such an investment, and it just hit its widest discount this year. What’s the catch? If the market indices have a huge year like in 2013, you’re probably going to give up some upside, but I’m willing to take that chance in 2015. I’ve been calling CEF investors insane for years based on what they buy and sell in this space and if you had followed my advice over the years, you would have been a heck of a lot better off now. So let’s take a look at this investment, the Nuveen Dow 30 Dynamic Overwrite fund (NYSE: DIAX ) , plus three others from one of the largest fund sponsors of mutual funds and CEFs available to investors. The New Nuveen US Equity Index Option CEFs Last summer, Nuveen announced the restructuring of all of their domestic (US) equity index option income CEFs to make them more streamlined and cost effective. The restructurings involved the merging of six of their funds into three funds (one S&P 500 index correlated, one DJIA index correlated and one NASDAQ-100 index correlated), thus becoming three much larger funds. One last fund, the Nuveen S&P 500 Dynamic Overwrite fund (NYSE: SPXX ) , would stand as is and just continue on as an S&P 500 correlated index fund with an updated option strategy. Here are the new Nuveen US equity index option CEFs (all information is as of 5/15/2015). Fund Ticker Market Price NAV Disc/Prem Market Yield Overwrite Target S&P 500 Buy/Write Income fund BXMX $12.85 $14.03 -8.4% 7.7% 100% Dow 30 Dynamic Overwrite fund DIAX $15.37 $17.09 -10.1% 6.9% 55% NASDAQ-100 Dynamic Overwrite fund QQQX $19.13 $20.57 -7.0% 7.3% 55% S&P 500 Dynamic Overwrite fund SPXX $14.20 $15.80 -10.1% 7.4% 55% All of the funds, except for the Nuveen NASDAQ-100 Dynamic Overwrite fund (NASDAQ: QQQX ) , received new ticker symbols and all of the funds received new names. None of the funds use leverage and none of them have any fixed income investments. In other words, they are essentially all equity index funds with an option sleeve of varying strike prices and expirations. Though the restructurings and mergers were announced last summer, they weren’t completed until late last year (12/22/14) so 2015 can really be used as the starting point for the new fund’s strategy and performance analysis. NOTE: For a more detailed look at the new structure and investment strategies of all four funds, please go to their Annual Report as of December 31, 2014. The crux of the restructurings, besides lowering the total number of funds from seven to four, involved an updated and more simplified approach to their index exposure as well as their option overwriting. All of the funds, except for the Nuveen S&P 500 Buy/Write Income fund (NYSE: BXMX ) , now have a 55% option overwrite percentage target with a range of 35% to 75% at the discretion of the portfolio managers. What this means is that the portfolio managers can adjust their option sleeve each month (or expiration period) consistent with their outlook for the markets or their particular index. This “Dynamic” option approach is designed to focus more on the options sleeve, i.e. the overall options positions with variable strike prices and expirations, rather than the stock portfolio itself. Prior to the restructurings and mergers last year, many of these same Nuveen index option CEFs just sold an established percentage of options against their index portfolios each expiration period without adjusting for market conditions. Not only that, many of the pre-merger funds wrote (sold) options against a very high 100% notional value of their stock portfolios. This was an extremely defensive option strategy that does not work well in a ramp up bull market. In fact, the pre-merger funds were so defensive that they were forced to reduce their distributions as the losses in their short option exposure accumulated during this bull market period. To give you a refresher course, option income funds work best in flat to even volatile up and down markets where no clear trend is established. Option income CEFs can still perform well in a bull market but the higher the percentage of options sold against their portfolios, the more difficult it will be for the fund’s NAV to keep up with their equity benchmarks. And selling 100% option coverage (based on the notional value) essentially means you believe the market has very little upside and you are willing to forgo any appreciation in exchange for the income derived from selling the options. In a down market or during a market correction, the NAVs of option income CEFs will certainly hold up better than their index benchmarks but they are not immune to NAV erosion in a prolonged bear market, even funds that sell options against 100% of their stock portfolios. Remember, the NAV of a fund represents its true value whereas the market price is established by investor demand and investor sentiment (often wrong) and can thus trade higher or lower than a fund’s NAV. The New Nuveen Performances So Far In 2015 So giving the new Nuveen index option funds more flexibility with their option overlays, i.e. making them more dynamic as opposed to static, should give the portfolio managers more opportunity to capture more NAV upside from their correlated indices. Only BXMX is maintaining a 100% option coverage though as we’ll see, that is not limiting its NAV performance so far this year. Here are the fund’s total return (Market and NAV) performances YTD compared to their benchmark ETFs. NOTE: Index ETFs make better comparables than the actual S&P 500, DJIA and NASDAQ indexes because ETFs include dividends whereas the indexes do not. Fund Ticker Mkt Tot Ret Perf NAV Tot Ret Perf Index ETF Index ETF Tot Ret Perf S&P 500 Buy/Write Income fund BXMX 8.2% 4.6% SPY 3.8% Dow 30 Dynamic Overwrite fund DIAX 1.4% 3.1% DIA 3.4% NASDAQ-100 Dynamic Overwrite fund QQQX 1.2% 5.3% QQQ 6.4% S&P 500 Dynamic Overwrite fund SPXX 1.1% 2.9% SPY 3.8% Here we can see that all of fund’s NAVs are at least keeping pace with their index ETFs and surprisingly, BXMX is actually beating the SPY index ETF despite its 100% overwrite option coverage. I’m not quite sure how this is happening other than that BXMX has about 300 positions out of the total S&P 500 positions while SPXX only has about 200. It’s not unusual for a fund to attempt to correlate to a broad index without taking on all of its positions and since the top positions and sector weightings are very consistent between all three S&P 500 related funds (SPY, BXMX & SPXX), it must be that BXMX’s portfolio managers, Ken Toft and Michael Buckius, have done a much better job in picking the bottom half of the fund’s portfolio out of the available 500 positions that make up the index. In any event, I would call your attention to the lagging market price performances of DIAX, QQQX and SPXX shown above despite their NAVs only slightly lagging their index performances. Is there an opportunity here? I think there is so let’s take a closer look So Why Are The Funds Seeing Widening Discounts? I own all of these funds across the board and except for BXMX, it’s been a bit disappointing to see the discounts widen in these funds as the year has progressed. I will get into why this may be happening in a moment but let me first show you the Premium/Discount graphs of two of the funds, DIAX and QQQX, from when the restructurings and mergers were completed in late December, 2014 (December 22nd to be exact) to today. Premium/Discount chart for DIAX from 12/22/2014 Premium/Discount chart for QQQX from 12/22/2014 As you can see, both DIAX and QQQX have seen their discounts widen substantially as the year has progressed from around -2% late last year to upwards of -10% for DIAX today. Considering both of these fund’s NAVs were outperforming their respective indices, the DJIA and NASDAQ-100, earlier this year when the indexes went negative, this is a surprise. Because despite a more flexible option writing strategy that should allow the fund’s NAVs to capture more upside, they are still more defensive than their respective indices in case the markets go negative. And yet, investors have sold off these funds as if the new strategies are not working. But then nobody, especially me, has called CEF investors very smart and in fact, most investors in these funds do just the opposite of what they should be doing. And that may be why these two funds, DIAX and QQQX in particular, have been selling off on their market prices despite their NAV performances. Because DIAX today represents the merger between Nuveen’s two old funds from last year, DPO and DPD. Though DIAX now is very similar to the old DPD from last year, except for the more dynamic option approach, this is not the case with DPO. DPO was essentially a leveraged version of the Dow Jones Industrial Average index and former shareholders of DPO were able to receive enhanced NAV performance when the DJIA was performing well. Could it be that former DPO shareholders are gradually ridding themselves of their converted DIAX shares because they no longer receive the leveraged exposure to the DJIA? Could be. And could QQQX, which represents the merger between the old QQQX and JLA funds, be suffering from the same selling affect from former JLA shareholders? JLA used to be one of the most defensive option income CEFs available to investors, selling 100% option coverage on its partly NASDAQ-100 and partly S&P 500 portfolio. So could it be that former JLA shareholders are gradually ridding themselves of their converted QQQX shares since they don’t receive the downside protection they once did in JLA? All of this is speculative and it could be that investors (both institutional as well as individual) may have owned all of the pre-merger funds across the board (like me) and after the restructurings and mergers were completed late last year, have reduced their positions in the combined funds since they are obviously quite a bit larger funds now. This would also explain why SPXX, which was the only fund that didn’t merge with another fund, hasn’t seen a dramatic change in its discount this year. Whatever the reason, I believe this is giving an opportunity for income investors to take a position or add to a position in DIAX and/or QQQX in particular, as once the selling pressure abates from former shareholders possibly, both of these funds should be able to reduce their discounted market prices. Conclusion I believe the major US indices, i.e. the S&P 500, Dow Jones Industrial Average and the NASDAQ-100, are in for more tepid returns going forward and may just be in a trading range for the foreseeable future, albeit not far from their all-time highs. And if that’s the case, then option income funds like the Nuveen index CEFs should continue to see less risky NAV performance compared to their correlated indices, i.e. NAVs that will slightly underperform on the upside while outperforming on the downside. And if the markets remain in a relatively flat trading range, then that will be just fine for these fund’s dynamic option strategies. Because when you get right down to it, index investing can be more exciting and even more lucrative when you invest in index option CEFs. Disclosure: The author is long DIAX, QQQX, BXMX, SPXX, SPY, DIA, QQQ. (More…) The author wrote this article themselves, and it expresses their own opinions. The author is not receiving compensation for it (other than from Seeking Alpha). The author has no business relationship with any company whose stock is mentioned in this article. Scalper1 News
Scalper1 News