Scalper1 News
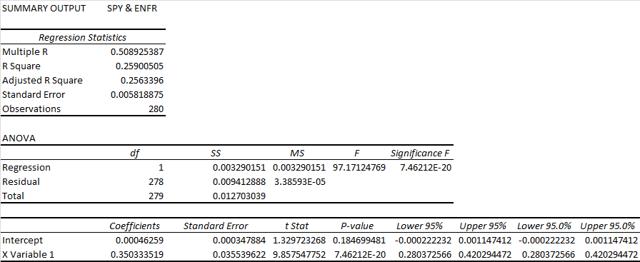
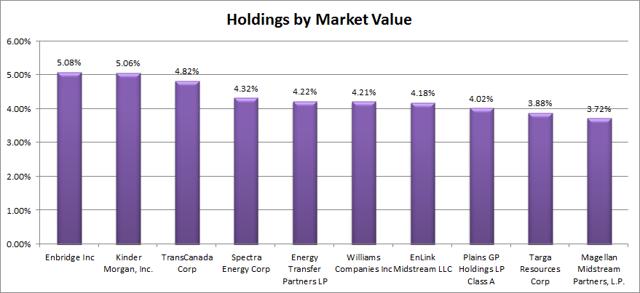 Summary I’m taking a look at ENFR as a candidate for inclusion in my ETF portfolio. The correlation to SPY is incredibly low but poor liquidity is reducing the reliability of statistics. The expense ratio is high and the holdings within the ETF could use more diversification. I wasn’t planning on using energy ETF, but the low correlation is too appealing. I’m not assessing any tax impacts. Investors should check their own situation for tax exposure. Investors should be seeking to improve their risk adjusted returns. I’m a big fan of using ETFs to achieve the risk adjusted returns relative to the portfolios that a normal investor can generate for themselves after trading costs. I’m working on building a new portfolio and I’m going to be analyzing several of the ETFs that I am considering for my personal portfolio. One of the funds that I’m considering is the Alerian Energy Infrastructure ETF (NYSEARCA: ENFR ). I’ll be performing a substantial portion of my analysis along the lines of modern portfolio theory, so my goal is to find ways to minimize costs while achieving diversification to reduce my risk level. What does ENFR do? ENFR attempts to track the total return (before fees and expenses) of the Alerian Energy Infrastructure Index. At least 90% of the assets are invested in funds included in this index. There are only 30 equity securities included in the index, so I’m expecting some diversification and volatility issues. ENFR falls under the category of “Energy Limited Partnership”. Does ENFR provide diversification benefits to a portfolio? Each investor may hold a different portfolio, but I use (NYSEARCA: SPY ) as the basis for my analysis. I believe SPY, or another large cap U.S. fund with similar properties, represents the reasonable first step for many investors designing an ETF portfolio. Therefore, I start my diversification analysis by seeing how it works with SPY. I start with an ANOVA table: (click to enlarge) The correlation appears incredible at 51%. I want to see low correlations on my investments. Extremely low levels of correlation are wonderful for establishing a more stable portfolio. I consider anything under 50% to be extremely low. However, for equity securities an extremely low correlation is frequently only found when there are substantial issues with trading volumes that may distort the statistics. The statistics appear too good to be true, which usually indicates that they are. I’ll keep an eye out for things that could distort the numbers. Standard deviation of daily returns (dividend adjusted, measured since November 2013) The standard deviation is very high for the relative calm sample period. For ENFR it is .9802%. For SPY, it is 0.6748% for the same period. While I’ve covered quite a few ETFs where the standard deviation was greater than 1%, those scores usually came from periods where SPY would have a standard deviation higher than .7200%. However, if the correlation really is 51%, I could work with the high deviations. Liquidity is a problem Average trading volume is running around 10,000 shares per day. It’s not completely illiquid, but it is pretty bad. In that time period, slightly under 280 trading days, the ETF reported a change from one closing value to the next (dividend adjusted) of 0.00% on 12 occasions. That might indicate days in which no shares changed hands, or the ending price might just have been the same as the prior day because of coincidence. For SPY, it happened 0 times during that period. However, SPY also trades at a much higher share price which reduces the chance of randomly having the same closing price since a one cent change in share price represents a smaller percentage of the price. The presence of 12 days in a sample of 280 is enough that it could have a meaningful influence on the calculated standard deviation and correlation of returns. I don’t think the poor liquidity is enough to explain away the correlation only being 51%, but it does reduce the reliability of the statistics. Mixing it with SPY I also run comparisons on the standard deviation of daily returns for the portfolio assuming that the portfolio is combined with the S&P 500. For research, I assume daily rebalancing because it dramatically simplifies the math. With a 50/50 weighting in a portfolio holding only SPY and ENFR, the standard deviation of daily returns across the entire portfolio is 0.7227%. With 80% in SPY and 20% in ENFR, the standard deviation of the portfolio would have been .6615%. If an investor wanted to use ENFR as a supplement to their portfolio, the standard deviation across the portfolio with 95% in SPY and 5% in ENFR would have been .6673%. Why I use standard deviation of daily returns I don’t believe historical returns have predictive power for future returns, but I do believe historical values for standard deviations of returns relative to other ETFs have some predictive power on future risks and correlations. Yield & Taxes The distribution yield is 1.97%. I like to see strong yields for retiring portfolios because I don’t want to touch the principal. By investing in ETFs I’m removing some of the human emotions, such as panic. Higher yields imply lower growth rates (without reinvestment) over the long term, but that is an acceptable trade off in my opinion. The poor liquidity would still concern me for any investor that needed even a moderate level of liquidity in the portfolio. I’m not a CPA or CFP, so I’m not assessing any tax impacts. Expense Ratio The ETF is posting an expense ratio of .65%. I want diversification, I want stability, and I don’t want to pay for them. I’m not attracted to the high expense ratio, but I won’t eliminate the ETF on the grounds of a high expense ratio because I’m still intrigued by the very low correlation. Market to NAV The ETF is at a .07% premium to NAV currently. Premiums or discounts to NAV can change very quickly so investors should check prior to putting in an order. I wouldn’t consider .07% to be meaningful, but investors should still watch out for the bid-ask spread. Poor liquidity is frequently connected with larger spreads. Largest Holdings The diversification within the ETF is fairly bland. I expected that because the underlying index had a fairly limited number of securities as well. In my opinion, the most reasonable way to use this ETF would be as a fairly small position within a large portfolio in which the investor was willing to sink in a little time watching for the right times to enter. Specifically, they would need to be watching the spread and the premium or discount to NAV. Additionally, the investor would need to be aware of their risk tolerances and liquidity needs. For an investor that meets all those criteria, this ETF might work. (click to enlarge) Conclusion I’m currently screening a large volume of ETFs for my own portfolio. The portfolio I’m building is through Schwab, so I’m able to trade ENFR with no commissions. I have a strong preference for researching ETFs that are free to trade in my account, so most of my research will be on ETFs that fall under the “ETF OneSource” program. I’m going to keep ENFR on my list as a potential candidate despite the fairly poor liquidity and high expense ratio. I don’t have a portion of the portfolio set aside for energy stocks, so the odds may be stacked against ENFR. If ENFR is selected, it would probably be used as 3% to 5% of the portfolio value. The major incentive for me is the low correlation, so I would want to run more statistical testing on the correlation over different time periods to reduce the risk of poor liquidity creating a misleading picture. Additional disclosure: Information in this article represents the opinion of the analyst. All statements are represented as opinions, rather than facts, and should not be construed as advice to buy or sell a security. Ratings of “outperform” and “underperform” reflect the analyst’s estimation of a divergence between the market value for a security and the price that would be appropriate given the potential for risks and returns relative to other securities. The analyst does not know your particular objectives for returns or constraints upon investing. All investors are encouraged to do their own research before making any investment decision. Information is regularly obtained from Yahoo Finance, Google Finance, and SEC Database. If Yahoo, Google, or the SEC database contained faulty or old information it could be incorporated into my analysis. The analyst holds a diversified portfolio including mutual funds or index funds which may include a small long exposure to the stock. Scalper1 News
Scalper1 News