Scalper1 News
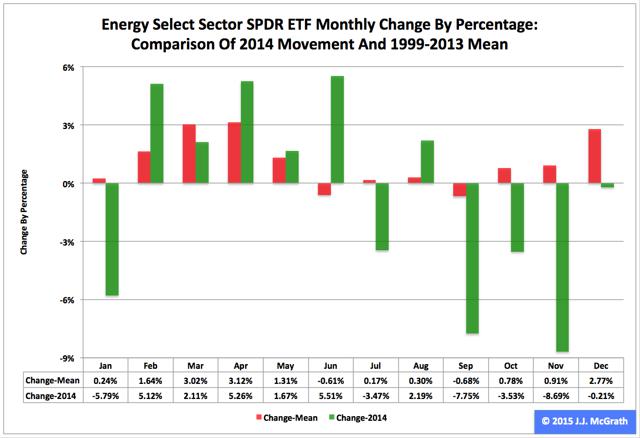
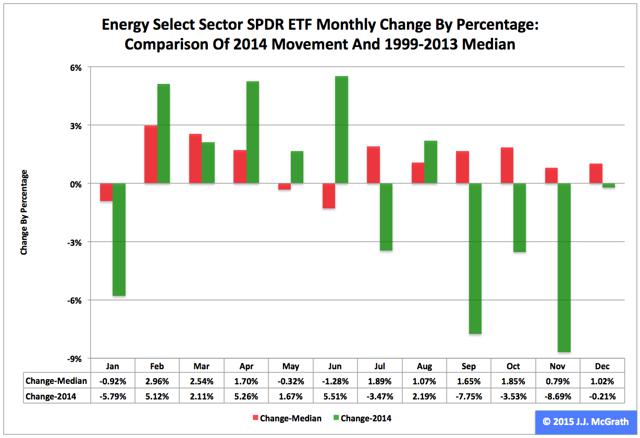
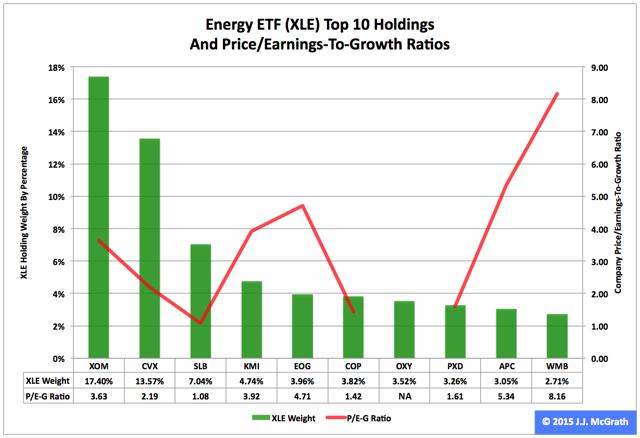
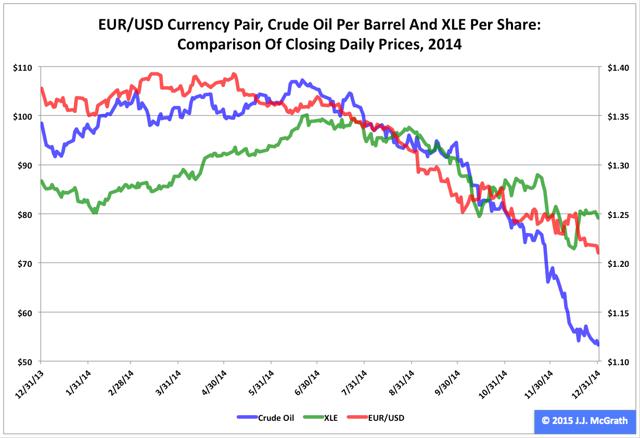 Summary The Energy exchange-traded fund finished ninth by return among the nine Select Sector SPDRs in 2014. The ETF was extraordinarily strong in the first half and even more extraordinarily weak in the second half. Seasonality analysis may be irrelevant until the commodity price of crude oil shows signs of stability. The Energy Select Sector SPDR ETF (NYSEARCA: XLE ) in 2014 ranked No. 9 by return among the Select Sector SPDRs that split the S&P 500 into nine segments. On an adjusted closing daily share-price basis, XLE dipped to $79.16 from $86.68, a drop of -$7.52, or -8.68 percent. As a result, it behaved worse than its sibling, the Utilities Select Sector SPDR ETF (NYSEARCA: XLU ) and parent proxy, the SPDR S&P 500 Trust ETF (NYSEARCA: SPY ) by -37.41 and -22.14 percentage points, in that order. (XLE closed at $72.86 Thursday.) XLE also ranked No. 9 among the sector SPDRs in the fourth quarter, when it performed worse than XLU and SPY by -25.29 and -17.00 percentage points, respectively. And XLE ranked No. 5 among the sector SPDRs in December, when it led SPY by 0.04 percentage point and lagged XLU by -3.79 points. Figure 1: XLE Monthly Change, 2014 Vs. 1999-2013 Mean (click to enlarge) Source: This J.J.’s Risky Business chart is based on analyses of adjusted closing monthly share prices at Yahoo Finance . XLE behaved a lot worse in 2014 than it did during its initial 15 full years of existence based on the monthly means calculated by employing data associated with that historical time frame (Figure 1). The same data set shows the average year’s weakest quarter was the third, with a relatively small negative return, and its strongest quarter was the first, with an absolutely large positive return. Inconsistent with its pattern last year, the ETF had a little gain in Q1, a big gain in Q2 and big losses in Q3 and Q4. Figure 2: XLE Monthly Change, 2014 Versus 1999-2013 Median (click to enlarge) Source: This J.J.’s Risky Business chart is based on analyses of adjusted closing monthly share prices at Yahoo Finance. XLE also performed a lot worse in 2014 than it did during its initial 15 full years of existence based on the monthly medians calculated by using data associated with that historical time frame (Figure 2). The same data set shows the average year’s weakest quarter was the second, with a relatively small positive return, and its strongest quarter was the third, with an absolutely large positive return. Meanwhile, I suspect seasonality analysis may be irrelevant until the commodity price of crude oil displays signs of stability. Figure 3: XLE’s Top 10 Holdings and P/E-G Ratios, Jan. 15 (click to enlarge) Notes: 1. “NA” means “Not Available.” 2. The XLE holding-weight-by-percentage scale is on the left (green), and the company price/earnings-to-growth ratio scale is on the right (red). Source: This J.J.’s Risky Business chart is based on data at the XLE microsite and Yahoo Finance (both current as of Jan. 15). With the possible exception of Schlumberger Ltd. (NYSE: SLB ), XLE’s top 10 holdings appear to range from fairly valued to overvalued (Figure 3). However, the numbers on the S&P 500 energy sector reported by S&P Senior Index Analyst Howard Silverblatt Dec. 31 indicated its valuation seems comparatively reasonable, with its P/E-G ratio at 1.16. Speaking of Schlumberger, the 2014 financial report it released Thursday was replete with evidence of the effects that the cratering in the commodity price of crude oil has had on the company in particular and, by extension, on the energy sector in general. Here are three of the highlights, or lowlights, of the report: [1] Although the functional currency of Schlumberger’s operations in Venezuela is the U.S. dollar, a portion of the transactions are denominated in local currency. Schlumberger has historically applied the official exchange rate of 6.3 Venezuelan Bolivares fuertes per U.S. dollar to remeasure local currency transactions and balances into U.S. dollars. Effective December 31, 2014, Schlumberger concluded that it was appropriate to apply the … exchange rate of 50 Venezuelan Bolivares fuertes per U.S. dollar as it believes that this rate best represents the economics of Schlumberger’s business activity in Venezuela. As a result, Schlumberger recorded a $472 million devaluation charge. [2] In response to lower commodity pricing and anticipated lower exploration and production spending in 2015, Schlumberger decided to reduce its overall headcount to better align with anticipated activity levels for 2015. Schlumberger recorded a $296 million charge associated with a headcount reduction of approximately 9,000. [3] Schlumberger determined that, primarily as a result of the recent decline in commodity prices, the carrying value of its investment in [a Schlumberger Production Management] development project in the Eagle Ford Shale was in excess of its fair value. Accordingly, Schlumberger recorded a $199 million impairment charge. I suspect many other energy-sector firms will be making similar announcements in the weeks, months and quarters to come. Figure 4: EUR/USD, Crude Oil And XLE, 2014 Daily Prices (click to enlarge) Note: The crude-oil and XLE scale is on the left, and the EUR/USD scale is on the right. Source: This J.J.’s Risky Business chart is based on analyses of adjusted closing daily share prices of XLE reported by Yahoo Finance ; closing daily prices of the New York Mercantile Exchange’s Cushing, OK Crude Oil Future Contract 1 reported by the U.S. Energy Information Administration ; and daily foreign-exchange rates of the euro/U.S. dollar, or EUR/USD, currency pair reported by the Federal Reserve Economic Data site of the Federal Reserve Bank of St. Louis. As indicated previously , I believe XLE’s upward movement in the first half of last year was primarily driven by market participants’ concern about the battle over control of Middle Eastern crude-oil assets between Islamic State of Iraq and the Levant, or ISIL, fighters on the one side and Iraqi government, Kurdish and aligned forces on the other side. I think the ETF’s downward movement since then has been primarily driven by market participants’ concern about the battle over monetary policy between major central banks: The U.S. Federal Reserve is oriented toward tightening, while the Bank of Japan, European Central Bank and People’s Bank of China all are oriented toward loosening. This bias divergence at the biggest central banks in the world already has had major effects on multiple markets, ranging from currencies (e.g., the euro/U.S. dollar cross, or EUR/USD) to commodities (e.g., crude oil) to the energy sector of the equity market (e.g., XLE), as suggested by Figure 4. Along this line, the amazing disappearance of about 18.79 percent in the euro/Swiss franc cross, or EUR/CHF, Thursday was but the latest manifestation of the wobbles in financial markets around the world. Measured by the daily prices of the components of the above chart, the EUR/USD currency pair peaked at $1.3927 March 13 (revisiting the area May 6), crude oil per barrel peaked at $107.26 June 20 and XLE per share peaked at $100.77 June 23. Their respective declines since then are clearly related, statistically speaking. Their lockstep movements appear likely to continue unless the Federal Open Market Committee makes clear it will delay the anticipated announcement of its interest-rate hikes April 29 and that it is preparing to carry out asset purchases under its fourth formal quantitative-easing program of the 21st century, aka QE4. The FOMC may be hard-pressed to present a convincing rationale for those actions, given the conditions described in “SPY Slips And U.S. Economic Index Slides In December.” But, without them, XLE may continue to be the equivalent of a canary in coal mine where things are looking darker by the day. Disclaimer: The opinions expressed herein by the author do not constitute an investment recommendation, and they are unsuitable for employment in the making of investment decisions. The opinions expressed herein address only certain aspects of potential investment in any securities and cannot substitute for comprehensive investment analysis. The opinions expressed herein are based on an incomplete set of information, illustrative in nature, and limited in scope. In addition, the opinions expressed herein reflect the author’s best judgment as of the date of publication, and they are subject to change without notice. Scalper1 News
Scalper1 News