Scalper1 News
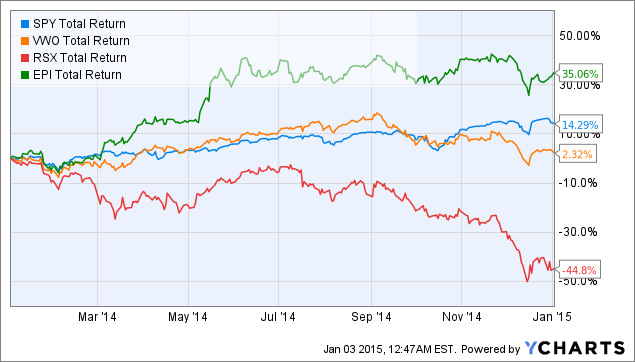
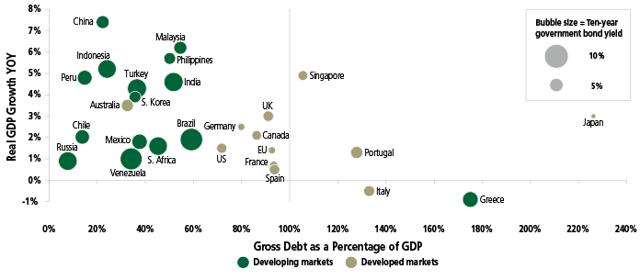
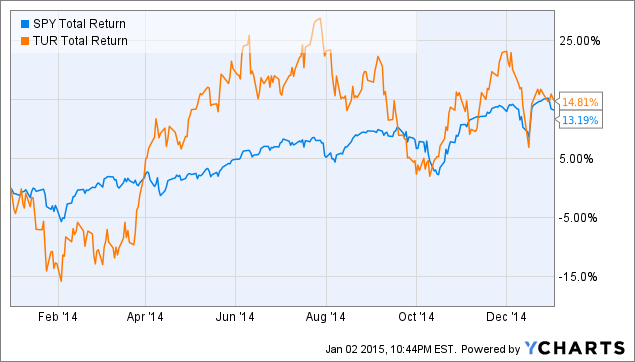
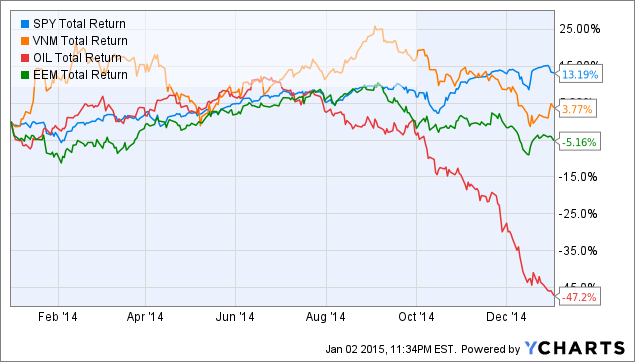 Summary Emerging markets in general underperformed compared to US equities. The range of results is wide – with some managing better returns than SPY. The EM story is one of high risk/ high return, but exposure is a must for the long term investor. This article reviews the EM pack for 2014 – top long term value picks, and some tactical picks for 2015. Emerging Markets – 2014 in review. Emerging markets overall put in a lackluster performance in 2014, with Vanguard’s Asia ETF (NYSEARCA: VWO ) returning just over 2% including dividends, compared to an overall return for US equities (NYSEARCA: SPY ) of 14.29%. There was, however, a wide range of performance from various markets, with the top performer, India (NYSEARCA: EPI ) notching up an impressive return of 35%, doubling SPY, and Russia (NYSEARCA: RSX ), down a massive 44%. SPY Total Return Price data by YCharts My own pick for 2014 was Turkey (NYSEARCA: TUR ), which also beat SPY, with an overall return of 15.8% for the year, 4th overall (removing duplicates) behind Philippines (NYSEARCA: EPHE ) 22.1%, and Indonesia (NYSEARCA: EIDO ), which gained 21.8%. Joining Russia at the bottom of the heap are Colombia (NYSEARCA: GXG ), -26.9%, Poland (NYSEARCA: EPOL ), -16.3%, and Chile (NYSEARCA: ECH ), -14.7%. I was personally surprised to see Korea (NYSEARCA: EWY ) generating a negative investor return of -13.5% in 2014. Investors with a really strong stomach for volatility, and a long term view would look for opportunities in Frontier markets, (NYSEARCA: FM ) (NYSEARCA: FRN ). It is not simple to construct an ETF to track these indices, as by definition they are not homogenous, and the performance is highly volatile. This is reflected by the wide variation in performance between the two indices, with FRN down 11.8%, and FM up 3.2% for 2014. The following table has the full picture, with ex dividend data from ETFReplay.com Emerging market ETF total returns. Ticker Fund 2014 2013 2012 2011 EPI WisdomTree India Earnings Index 27.80% -9.20% 25.30% -40.40% EPHE iShares MSCI Phillipines 22.10% -7.70% 47.90% -4.50% EIDO iShares MSCI Indonesia Index 21.80% -23.30% 4.50% 1.90% INDA iShares MSCI India 21.70% -5.00% 0 0 IDX Market Vectors Indonesia 16.60% -23.20% 2.40% -0.60% TUR iShares MSCI Turkey 15.80% -27.30% 65.60% -36.60% THD iShares MSCI Thailand Index 15.50% -14.60% 40.20% -4.20% EGPT Market Vectors Egypt Index 13.60% 7.30% 44.70% -51.70% FXI iShares FTSE China 25 Index Fund 11.40% -2.20% 19.20% -17.60% EWT iShares MSCI Taiwan Index Fund 6.90% 7.80% 18.70% -21.90% GULF WisdomTree Middle East Dividend Index 6.90% 38.00% 7.30% -9.60% MCHI iShares MSCI China Index 6.80% 2.10% 23.30% 0 VNM Market Vectors Vietnam 5.10% 7.80% 26.30% -43.80% FM iShares MSCI Frontier Markets ETF 3.20% 23.70% 0 0 EZA iShares MSCI South Africa Index 2.70% -7.50% 21.10% -15.70% MES Market Vectors DJ Gulf States (NYSEARCA: GCC ) Titans 1.60% 35.90% 6.50% -14.50% GAF SPDR S&P E.M. Middle East & Africa 0.20% -4.70% 21.50% -18.40% EPU iShares MSCI Peru Index -3.60% -25.40% 24.20% -21.80% EWM iShares MSCI Malaysia Index Fund -11.60% 7.80% 14.80% -2.70% EWW iShares MSCI Mexico Index Fund -11.60% -1.60% 32.80% -12.00% FRN Guggenheim BNY Mellon Frontier Mkts -11.80% -14.60% 12.30% -22.40% EWY iShares MSCI South Korea Index Fund -13.50% 3.50% 21.90% -13.50% ECH iShares MSCI Chile Fund -14.70% -23.90% 11.30% -26.40% EPOL iShares MSCI Poland Index -16.30% 3.70% 41.60% -32.20% GXG Global X Interbolsa FTSE Colombia 20 -26.90% -15.00% 27.40% -15.20% RSX Market Vectors DAXglobal Russia -47.20% -0.90% 15.00% -28.20% Aggregate performance 2011-2014. Expanding the picture, the table below adds the performance for the period since 2011, and reorders the aggregate performance: Emerging market ETF total returns. Ticker Fund 2011-2014 2014 2013 2012 2011 EPHE iShares MSCI Phillipines 57.80% 22.10% -7.70% 47.90% -4.50% GULF WisdomTree Middle East Dividend Index 42.60% 6.90% 38.00% 7.30% -9.60% THD iShares MSCI Thailand Index 36.90% 15.50% -14.60% 40.20% -4.20% MCHI iShares MSCI China Index 32.20% 6.80% 2.10% 23.30% 0 MES Market Vectors DJ Gulf States Titans 29.50% 1.60% 35.90% 6.50% -14.50% FM iShares MSCI Frontier Markets ETF 26.90% 3.20% 23.70% 0 0 TUR iShares MSCI Turkey 17.50% 15.80% -27.30% 65.60% -36.60% INDA iShares MSCI India 16.70% 21.70% -5.00% 0 0 EGPT Market Vectors Egypt Index 13.90% 13.60% 7.30% 44.70% -51.70% EWT iShares MSCI Taiwan Index Fund 11.50% 6.90% 7.80% 18.70% -21.90% FXI iShares FTSE China 25 Index Fund 10.80% 11.40% -2.20% 19.20% -17.60% EWM iShares MSCI Malaysia Index Fund 8.30% -11.60% 7.80% 14.80% -2.70% EWW iShares MSCI Mexico Index Fund 7.60% -11.60% -1.60% 32.80% -12.00% EIDO iShares MSCI Indonesia Index 4.90% 21.80% -23.30% 4.50% 1.90% EPI WisdomTree India Earnings Index 3.50% 27.80% -9.20% 25.30% -40.40% EZA iShares MSCI South Africa Index 0.60% 2.70% -7.50% 21.10% -15.70% GAF SPDR S&P E.M. Middle East & Africa -1.40% 0.20% -4.70% 21.50% -18.40% EWY iShares MSCI South Korea Index Fund -1.60% -13.50% 3.50% 21.90% -13.50% EPOL iShares MSCI Poland Index -3.20% -16.30% 3.70% 41.60% -32.20% VNM Market Vectors Vietnam -4.60% 5.10% 7.80% 26.30% -43.80% IDX Market Vectors Indonesia -4.80% 16.60% -23.20% 2.40% -0.60% EPU iShares MSCI Peru Index -26.60% -3.60% -25.40% 24.20% -21.80% GXG Global X Interbolsa FTSE Colombia 20 -29.70% -26.90% -15.00% 27.40% -15.20% FRN Guggenheim BNY Mellon Frontier Mkts -36.50% -11.80% -14.60% 12.30% -22.40% ECH iShares MSCI Chile Fund -53.70% -14.70% -23.90% 11.30% -26.40% RSX Market Vectors DAXglobal Russia -61.30% -47.20% -0.90% 15.00% -28.20% Top of the leader board here is Philippines ( EPHE ), with a 58% return over the period, lagging the 75% return of US equities over the equivalent period. Next up are the Gulf states, whose economies have been booming in the years since the financial crisis, with a recent challenge arising from the slump in the oil price in the second half of 2014. Thailand (NYSEARCA: THD ) and China (NYSEARCA: FXI ) (NYSEARCA: MCHI ) have both been strong performers over the period, with China attracting keen but volatile investor interest, as growth there has slowed. The price of Chinese shares has been more muted, with the recent surge in China A shares driven more by changes to market access for foreign investors than fundamentals. Egypt (NYSEARCA: EGPT ) was a strong performer in 2014, in the aggregate suffering along with India and Vietnam (NYSEARCA: VNM ) from a catastrophic performance in 2011. Markets with a consistently poor track record at the bottom of the performance chart include Russia ( RSX ), Chile ( ECH ), Frontiers ( FRN ), Colombia ( GXG ) and Peru (NYSEARCA: EPU ). EM themes for 2015. The following key themes will dictate the outlook for emerging market attractiveness in the coming year: Commodity prices – especially oil. The recent drop in oil prices has a significant impact on emerging markets, with some markets, such as Russia, Brazil, and the Middle East already suffering in 2014. These markets can continue to underperform while oil prices remain low. OPEC, specifically Saudi Arabia, seem determined to keep oil production at current levels until higher cost marginal producers such as shale players are squeezed out – while forecasting commodity prices is not straightforward, EM investors should work with a baseline scenario of current price levels being maintained for much of 2015. Markets with a high net oil import as a percentage of GDP will benefit from lower oil prices. The top 50 importers are compiled here by Prominent EM’s include Thailand, China, Korea, India, Turkey and Indonesia. Currency risk. Investors in emerging markets recall the painful currency issues around the Asian crisis in the late 90s, when economies with high external debts in US dollars saw their currencies crushed. The greenback has shown strength through 2014, and the majority of currency strategists are tipping further gains in 2015. In this scenario, markets with relatively lower exposure to external debt should fare better. The following graphic shows the balance of debt burden as a percentage of GDP with the real growth rates to support that debt. Emerging market bulls also point to the increase of local currency debt, and local debt holders in many emerging markets as factors that have improved the risk profile for emerging markets. GDP growth, debt-to-GDP and borrowing costs (click to enlarge) Source: JP Morgan. ‘Guide to the Markets’ March.2014 Structural economic reforms. Several of the prominent EM’s are undergoing a process of structural economic reforms, as they position for the jump to mature status. These vary from country to country, but key themes are around corporate governance, access to international capital markets, the reduction of bureaucracy (or corruption), tax reform, unwinding of energy subsidies, and import substitution policies. International investors will be keenly watching the progress of several markets in enacting these reforms. Foreign direct investment, and equity investments will be pulled towards those economies which demonstrate progress to sustainable growth. New leadership in India and Indonesia will be under close scrutiny. In India, prime Minister Modi is the figurehead for a new business friendly leadership. The market’s dramatic rise in 2014 anticipates some significant changes, however, the Indian political process is complex, and Modi’s ability to make real progress is now under scrutiny. In Indonesia, President Joko Wibowo , popularly known as “Jokowi” is a potential game changer. His background as a small business owner, and track record in Indonesian politics, most recently as mayor of the capital, Jakarta, promise much. He takes a hard line on corruption and bureaucratic waste. Critics question his somewhat nationalistic policies, and his depth of experience in economic management at the national scale. China, under Ji Xinping, is shifting from a focus on absolute GDP growth to balanced and sustainable growth. This involves managing the key risks of an overheated asset market, which has been stimulated by poorly regulated lending, and the potential for enhanced inflationary pressures if the Yuan is not allowed to appreciate against other currencies. Private debt levels in China are not transparent, as there is a significant ‘shadow banking’ industry – however it is safe to say that the China economy is more highly leveraged than the official figures show. Current fundamental valuations. One obvious reason for investors to consider diversifying into emerging markets is to seek valuations that are more appealing than the current levels of the US markets, which are currently showing strong valuations on several metrics. I find the following data compiled by German analyst Star Capital to be a useful overview: This indicates China, Turkey, and Russia as the three top value markets from a balanced view of several valuation models. On this analysis, India and Indonesia appear among the emerging markets offering the poorest value. Outlook for 2015 Bringing these factors together, my outlook for emerging markets for 2015: Russia – suffered terribly in 2014 due to the oil price collapse and the economic sanctions combined. Rouble devaluation has added to the challenge. While representing cheap valuations, the story for Russia in 2015 is tied to Oil. A strong rebound in 2015 is possible, but only following a bottom in the oil price – expect RSX to underperform again this year. Eastern European satellites tend to follow Russia’s fortunes. China – ended 2014 well, and still has relatively good value metrics. With China, the risk of an asset bubble deflation and a hard landing could see the recent progress unwind. Low energy prices should help China in 2015. I am bullish in the long run, and at a single digit trailing p/e, with 7% growth expected, there is some risk buffer. I expect China to see some volatility in 2015, but do feel that I need to add China exposure to my portfolio during the year. India – despite the oil price tailwind, I see some challenges ahead in India meeting the expectations of exuberant investors. With prices at nearly 20 times earnings and just under 3 times book value, India looks a little spicy for me! I expect to see progress in 2015, but not to see India at the top of the 2015 performance charts. Latin America – typically exposed to oil prices, with high debt burdens, I see a further year of challenge ahead for most Latin markets. Mexico has some advantages in terms of proximity and exports to US, so should benefit from a US recovery – however valuations show less room for upside. My pick for 2015. I continue to see Turkey as a strong emerging market performer for 2015, backing up from a 4th place in 2014. As can be seen from this chart, TUR outperformed SPY by a wide margin for much of the year. SPY Total Return Price data by YCharts The stock price pattern for the year has followed the sentiment of SPY investors, correcting both to the upside and the downside. My thesis for continued strong performance for TUR is: Good long term economic and demographic outlook. Continued political progress by Erdogan – not smooth, but the situation has stabilised. Low oil prices continue during 2015. Debt burden under control. Current valuations are modest. To the downside, I see TUR could suffer in price if there is a major US correction – for me this would represent a buying opportunity. I do recommend stops or hedging for more volatile positions. Like most EM’s TUR can be suddenly impacted by domestic political or social issues. EM to accumulate for the long term. Vietnam is an unsung hero of South East Asia. Vietnam has a vibrant and dynamic demographic, and is shifting its economy from a commodity exporter to an industrial and manufacturing base. While still a net oil exporter of crude oil, Vietnam is becoming a favourite manufacturing alternative to China and Thailand for foreign high tech firms. In 2011, performance was impacted by a property bubble – this has now deflated, the currency has stabilised, and risk factors are now neutral. As can be seen from the chart below, VNM was another high performer out of EM’s for much of 2014. It proved resilient to the early decline in oil process, but as broad emerging markets (NYSEARCA: EEM ) started to decline, VNM followed the momentum down. SPY Total Return Price data by YCharts Lower oil prices will impact Vietnamese government tax revenues, and this might have some impact on fiscal stimulus in the short term. I see Vietnam as a natural successor to Thailand in the region, and will accumulate on any price weakness. With a p/e multiple of 13.5 at current pricing, I am accumulating VNM. Expect VNM to perform in line with EEM for 2015. In summary – I am convinced that it is important for long term growth investors to have exposure to emerging markets. Careful analysis of macro trends is needed to identify the markets that will add value to a portfolio. It is also important to consider valuation, as EM investors can sometimes overreach the fundamentals. I look for potential first, macro environment second, then value. TUR & VNM will be my focus for 2015. Disclaimer: The author is a private investor, and not an investment adviser. Analysis and opinions are shared for the interest of readers and are not, and should not be used as investment advice. Always consult a professional adviser. Scalper1 News
Scalper1 News