Scalper1 News


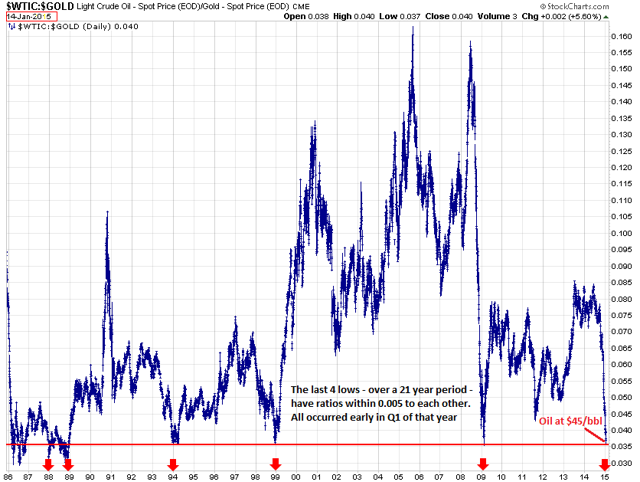
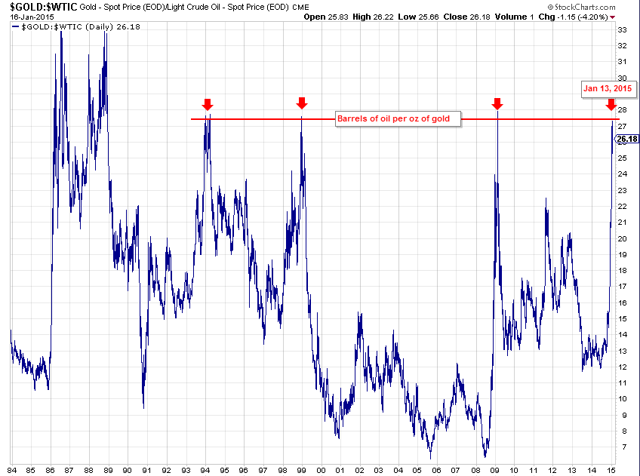
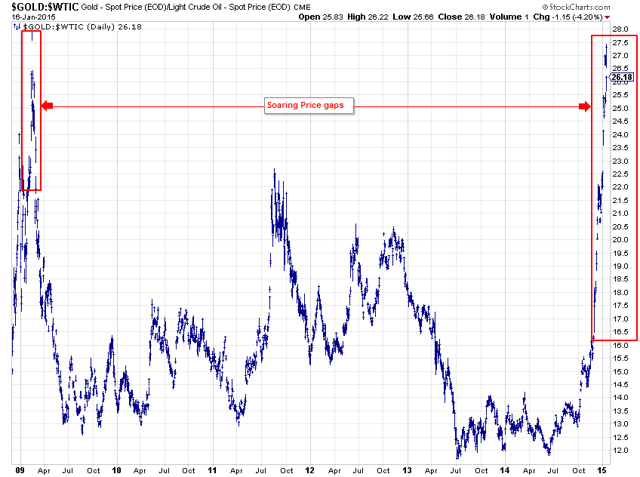
 An inflection point has been reached in oil’s valuation per barrel. The Oil/Gold ratio at this level has historically confirmed a trend change. The supply/demand news cycle is beginning to turn. (The Oil/Gold Ratio: click to enlarge) The first thing one sees in the chart (above) is an almost perfect symmetry, with each low point occurring early in Q1 on the red line (excepting 1986, 88, 89). It begs a question for the curious: Under what previous economic conditions did the oil/gold ratio reach today’s extremes? What is the correlation in barrels per oz. of gold?” “How far into this drop are we currently?” We are at Financial Crisis lows (2008-09); and the deep devaluations of the late-1980s are the only levels remaining to be pierced. The oil/gold ratio has been at this level three times in the last two decades, and each time it rallied. The current comparison clocks in at $45/bbl. How cheap is oil? Early this morning you could buy 28 barrels of oil with a single oz. of gold, the most in the modern era (excepting 1988). I am using the price of gold to value a barrel of crude because gold is a storage of value. Oil is a cultural commodity and the substrate of modern industrial society. In terms of financial comparisons, gold retains its value, oil we use ubiquitously. The ratio measures the cost of that use. Observe the parabolic surges in the chart below. Excepting the go-go years of impossibly cheap oil (1986 and 1989), each one of these telephone-pole tops flamed-out quickly. (click to enlarge) If zoomed-in for a closer look (below), you can see that the final weeks of the surge (red boxes) were composed of unsustainable, soaring price-gaps. For example, an ounce of gold this morning could buy you 33% more oil than on January 1, 2015, less than 3 weeks ago; or 60% more oil than in November, 2014! Is this any way to price a commodity that’s used 91ML bbl a day? In just the last week we have had several 5% up and down days close-by in sequence, resulting in single-session half-trillion dollar gains or losses for crude oil. This kind of price discovery only occurs near turning-points – when the market can’t figure out what something is worth – when all the news and analysis is clouded in total confusion – and hence the focus of this article. For ages, if you wanted to figure out what something was worth, you compared it to gold; and at this point, oil is as cheap as it gets. (click to enlarge) In my previous articles, I have used a pressure-cooker model to scale into positions through dollar-cost averaging, buying at gradual intervals over a few weeks time. This method sometimes takes weeks, even months, to fulfill, but in the end it works, because every tick down lowers the cost-basis before the eventual turn. The important thing is to begin near the extremes. Crude oil is selling for less than it takes to drill, ship and deliver it almost anywhere in the world. Some OPEC countries could actually default on their debts if crude oil remains in this state of devaluation. But there is hope on the horizon. An upcoming storm of lay-offs, falling rig counts, and production cuts is beginning to slash into the North American crude suppliers (the source of oversupply), and by 2Q’2015 this pullback should be in full swing. SA author Wolf Richter fully describes this retrenchment in his fiery articles . The trade here is to gradually buy into a crude oil ETF, for example, XLE , OIL , or USO , and hold until oil hits $70/bbl. For the more speculative investor, the leveraged ETFs – UCO (2x crude), or UWTI (3x crude) are also an option. Scalper1 News
Scalper1 News