Scalper1 News

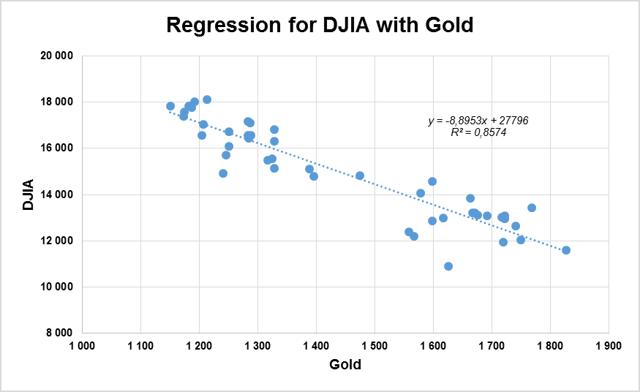
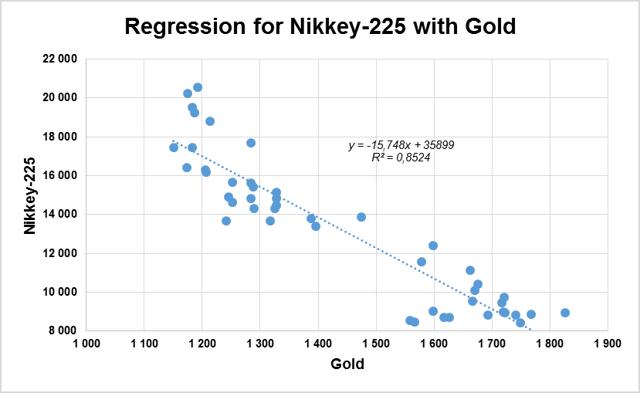
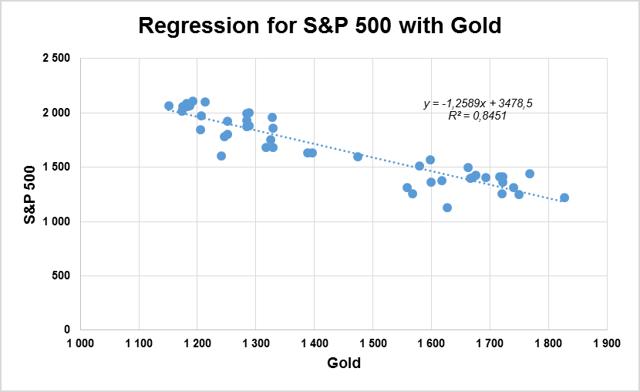
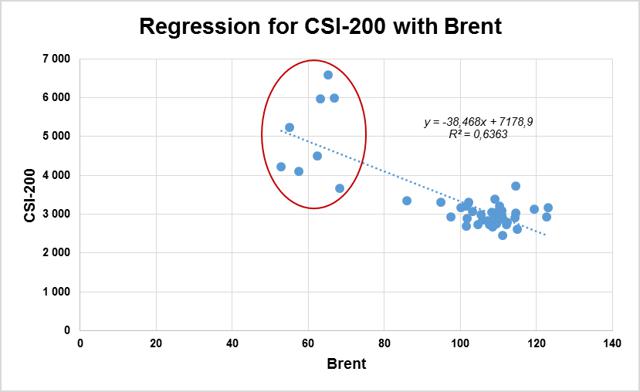
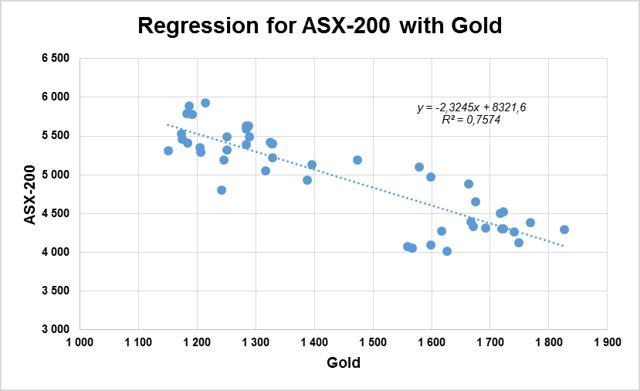
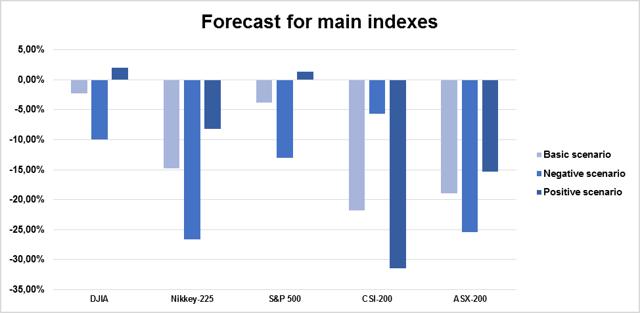 Summary This article is made to show the correlation relationships of oil, gold, copper and silver price with DJIA, S&P 500, NASDAQ, CSI-200, Nikkey-225 and ASX-200. The main idea is that the cycles of these fundamental commodities’ prices are the origins of the change in the stocks’ quotations. Investors can use this information to make investment decisions according to the current fundamental situation. The main conclusions about the future prices of the indexes are given in the section “Conclusions”. Introduction: This article was made to show the way to determine if the stock indexes are overvalued or undervalued according to the fundamental power of commodities. In fact, the correlation relationships among commodities and different indexes were discovered long before me (e.g., Sam Ro on Business Insider showed the correlation of different commodities with S&P 500). Using this information, investors can determine if the stock index is overvalued (undervalued) or not. Main tools for this research were the correlation analysis and the linear regression analysis. Correlation analysis measures the power of the relationship between 2 assets. If the correlation is 1, it means, that the price change of the first asset for 1% will make the price of the second asset change by 1%. If the correlation is -1, absolutely negative, it means that the change of price for 1 asset by 1% will tend to a -1% price change of another asset. The linear regression analysis is a formal tools to investigate the actual formula for the correlation relationship. Usually written in the form “Y = a + bx”, where a and b are investigated by the least-squared method (more formally, ordinary least squares method – OLS). For example, if a is 2 and b is 3, the formula looks like “Y = 2 + 3x”. If x is 3, Y tends to be 2 + 3 * 3 = 11. These technics are extremely useful when there is a significant change of the factors, which happens nowadays. And I do want to determine the fact that according to my analysis, most top indexes are extremely overvalued. Body of research: Without a shadow of a doubt, it is evident that main indexes are the “mirrors” of the future economic development of the country. Obviously, if the country’s structure of GDP is mostly connected with the mining and manufacturing industry, the prices for such commodities as oil, gold, copper and silver strongly affect the perspectives of the future economic growth. Oil is used as the main source of energy; Gold and silver are widely used in the electronic industry; Copper, in fact, is used everywhere. The main hypothesis of this article is: first – if the prices for these commodities really affect the price of the main world’s indexes? second – if the first is true, how can we measure this effect? As you can see in the Table 1, there are several strong relationships among assets: Brent is positively correlated with all types of commodities, mostly with copper, and negatively correlated with all main indexes. The strongest negative correlation is with CSI-200, so it confirms the fact, that cheap oil makes the economics of China grow faster. The weakest correlation is with ASX-200, so Australian stocks are the most “oil-neutral” among other considered indexes; WTI shows the same tendency as Brent; Gold has the strongest negative correlation among all commodities with the top American indexes. In my opinion, the main reason for this fact is that gold has always been the main substitute for USD currency. Strong dollar means a low price of gold, so they are negatively correlated by nature. As the Japanese yen is one of the 4 widely used currencies in the World, Nikkey-225 is strongly negatively correlated with the price of gold. CSI-200 is a Chinese index and it is least negatively correlated with this metal; Silver shows the same tendency with gold for the similar reasons, stated above; Copper, the main indicator of economical development, shows a negative correlation with all indexes. However, it is not as strong as other commodities. Table 1. The Correlation Matrix (click to enlarge) Source: information found in the Internet, author’s calculations According to these facts, we can make several conclusions: All the commodities are positively correlated with each other and negatively correlated with main indexes; The most powerful indicators are Gold, Brent (CSI-200), and Silver When determining the formula for DJIA, Nikkey-225, S&P 500 and ASX-200 I will use Gold. Brent price will be used for creating the CSI-200 formula. The linear regression model for DJIA with the gold factor shows the 86% reliability of this factor. (click to enlarge) The linear regression model for Nikkey-225 with the gold factor shows the 85% reliability of this factor. (click to enlarge) The linear regression model for S&P 500 with the gold factor shows the 85% reliability of this factor. (click to enlarge) The linear regression model for CSI-200 with the Brent factor shows the 63% reliability of this factor. However, the main reason for such a low level of reliability is a low price of Brent (rounded by a red circle). (click to enlarge) The linear regression model for ASX-200 with the gold factor shows the 76% reliability of this factor. (click to enlarge) Forecast: I consider 3 scenarios which can affect the prices of the Brent and gold. For the target Brent price of $65 and the Gold price of $1184 (“Basic scenario”) the target index values are: DJIA = 17 264 (-2,26%) Nikkey-225 = 17 253 (-14,76%) S&P 500 = 1988 (-3,82%) CSI-200 = 4678 (-21,80%) ASX-200 = 4426 (-18,92%) For the target Brent price of $40 and the Gold price of $1336 (“Negative scenario”) the target index values are: DJIA = 15 912 (-9,91%) Nikkey-225 = 14 860 (-26,58%) S&P 500 = 1797 (-13,06%) CSI-200 = 5640 (-5,72%) ASX-200 = 4073 (-25,93%) For the target Brent price of $80 and the Gold price of $1100 (“Positive scenario”) the target index values are: DJIA = 18 011 (1,97%) Nikkey-225 = 18 576 (-8,22%) S&P 500 = 2094 (1,31%) CSI-200 = 4101 (-31,45%) ASX-200 = 4622 (-15,33%) (click to enlarge) Conclusions: Commodities, especially gold and Brent, strongly correlate with the stock indexes ; According to the target Brent price of $65 and the gold price of $1184 (“Basic scenario”), all the remaining indexes tend to fall in price; If Brent is $40 and the gold price is $1336 (“Negative scenario”), most American indexes will dramatically decline in price. Nikkey-225 will fall for more than 25%. In spite of the fact, that low oil price is favorable for China, CSI-200 will fall by 5,72%; The “Positive scenario”, which main assumptions are $80 for Brent and $1100 for gold, provides a small opportunity for DJIA and S&P 500 to rise. But CSI-200 can terribly go down in price for more than 36%; My opinion In fact, the correlation relationships can change during the time, that’s why there is a probability that these models so not work. But my advice is to be careful in long positions with all of these indexes, especially for CSI-200 and Nikkey-225, which seem to be overbought. Technical information The time frame for the investigation was chosen as from 08/01/2011 to 06/01/2015 monthly, or 47 points. The main reason for such a frame was the lack of data, but according to the central limit theorem, the time frame is quite enough to determine the tendency, using correlation and regression analysis tools. All the data was given at the beginning of the month. If there were no trades at the 1st day of the month, the data was taken for the 2nd or the 3rd day. The correlation and regression analysis metrics were measured using Excel Add-ins. Disclosure: I/we have no positions in any stocks mentioned, and no plans to initiate any positions within the next 72 hours. (More…) I wrote this article myself, and it expresses my own opinions. I am not receiving compensation for it (other than from Seeking Alpha). I have no business relationship with any company whose stock is mentioned in this article. Additional disclosure: All the provided data can not be properly used for making investment decisions until consultation of the professional. Scalper1 News
Scalper1 News