Scalper1 News
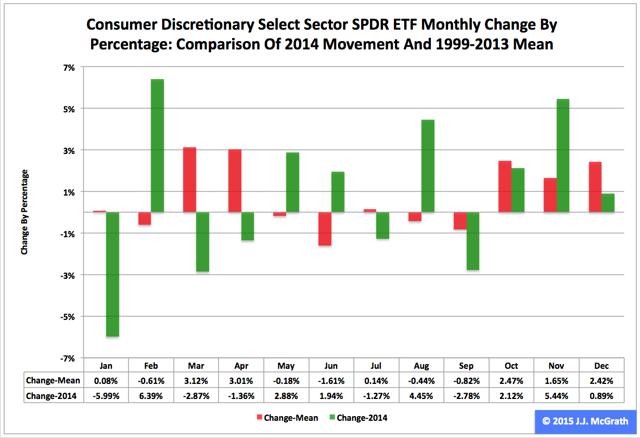
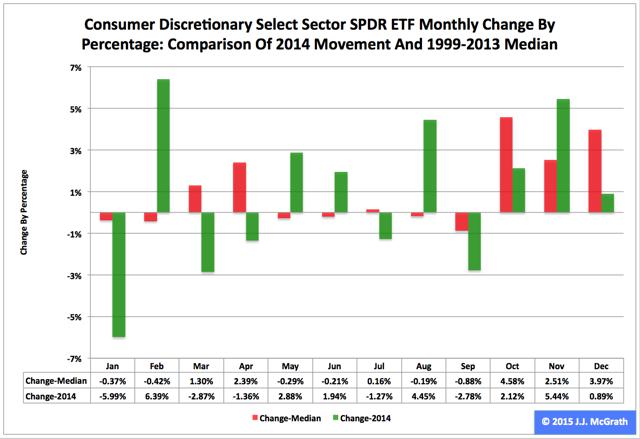
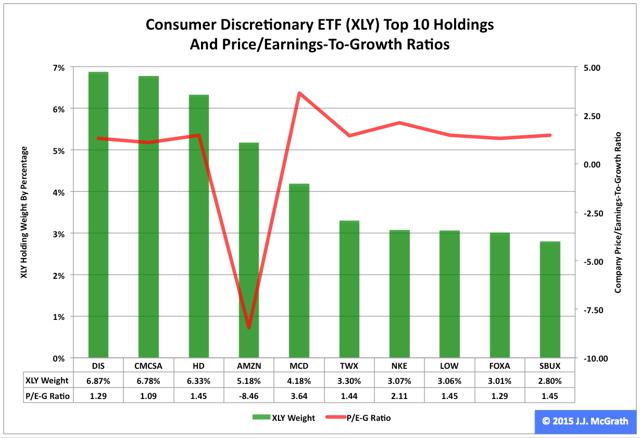 Summary The Consumer Discretionary exchange-traded fund finished seventh by return among the nine Select Sector SPDRs in 2014. The ETF was relatively weak in the first and third quarters, absolutely strong in the second and fourth quarters. Seasonality analysis of Q1 is a mixed bag, but my data interpretation points to a middle-of-the-pack performance. The Consumer Discretionary Select Sector SPDR ETF (NYSEARCA: XLY ) in 2014 ranked No. 7 by return among the Select Sector SPDRs that partition the S&P 500 into nine pieces. On an adjusted closing daily share-price basis, XLY advanced to $72.15 from $65.91, a gain of $6.24, or 9.47 percent. Thus, it behaved worse than its sibling, the Utilities Select Sector SPDR ETF (NYSEARCA: XLU ) and parent proxy, the SPDR S&P 500 Trust ETF (NYSEARCA: SPY ) by -19.27 and -4.00 percentage points, respectively. (XLY closed at $70.51 Tuesday.) XLY ranked No. 2 among the sector SPDRs in the fourth quarter, when it led SPY by 3.74 percentage points and lagged XLU by -4.54 points. And XLY ranked No. 3 among the sector SPDRs in December, when it performed better than SPY by 1.15 percentage points and worse than XLU by -2.68 points. Figure 1: XLY Monthly Change, 2014 Vs. 1999-2013 Mean (click to enlarge) Source: This J.J.’s Risky Business chart is based on analyses of adjusted closing monthly share prices at Yahoo Finance . XLY behaved about the same in 2014 as it did during its initial 15 full years of existence based on the monthly means calculated by employing data associated with that historical time frame (Figure 1). The same data set shows the average year’s weakest quarter was the third, with an absolutely large negative return, and its strongest quarter was the fourth, with an absolutely larger positive return. Generally consistent with this pattern last year, the ETF had a very small gain in Q3 and a very large gain in Q4. Figure 2: XLY Monthly Change, 2014 Versus 1999-2013 Median (click to enlarge) Source: This J.J.’s Risky Business chart is based on analyses of adjusted closing monthly share prices at Yahoo Finance. XLY performed worse in 2014 than it did during its initial 15 full years of existence based on the monthly medians calculated by using data associated with that historical time frame (Figure 2). The same data set shows the average year’s weakest quarter was the third, with a relatively large negative return, and its strongest quarter was the fourth, with an absolutely large positive return. It also shows there is no historical statistical tendency for the ETF to explode in Q1. Figure 3: XLY’s Top 10 Holdings and P/E-G Ratios, Jan. 13 (click to enlarge) Note: The XLY holding-weight-by-percentage scale is on the left (green), and the company price/earnings-to-growth ratio scale is on the right (red). Source: This J.J.’s Risky Business chart is based on data at the XLY microsite and Yahoo Finance (both current as of Jan. 13). To me, many of XLY’s component companies appear mispriced, either by a little or by a lot (Figure 3). I discussed one of them in “Amazon.com: The Most Overvalued Profitable Company In The S&P 500, Still” a while ago. Since then, Amazon (NASDAQ: AMZN ) has slipped back to unprofitability from profitability, but it remains overvalued. However, the facts on the S&P 500 consumer-discretionary sector reported by S&P Senior Index Analyst Howard Silverblatt Dec. 31 seem to be at variance with my opinions about it: He calculated its P/E-G ratio as 1.15, the lowest level of any of the index’s 10 sectors. Harrumph. The valuation issue aside, XLY’s prospects may be brighter now than they were six months ago: Among the Select Sector SPDRs, the ETF might be the biggest beneficiary of the collapse in the crude-oil commodity market, where the CME Group front-month futures price per barrel fell to $45.89 Tuesday from $107.26 June 20, a tumble of $61.37, or 57.22 percent, according to the U.S. Energy Information Administration . (The contract settled at $48.48 Wednesday, the CME Group reported.) Therefore, I would be completely unsurprised should XLY be a middle-of-the-pack performer among the sector SPDRs this quarter. Disclaimer: The opinions expressed herein by the author do not constitute an investment recommendation, and they are unsuitable for employment in the making of investment decisions. The opinions expressed herein address only certain aspects of potential investment in any securities and cannot substitute for comprehensive investment analysis. The opinions expressed herein are based on an incomplete set of information, illustrative in nature, and limited in scope. In addition, the opinions expressed herein reflect the author’s best judgment as of the date of publication, and they are subject to change without notice. Scalper1 News
Scalper1 News