Scalper1 News

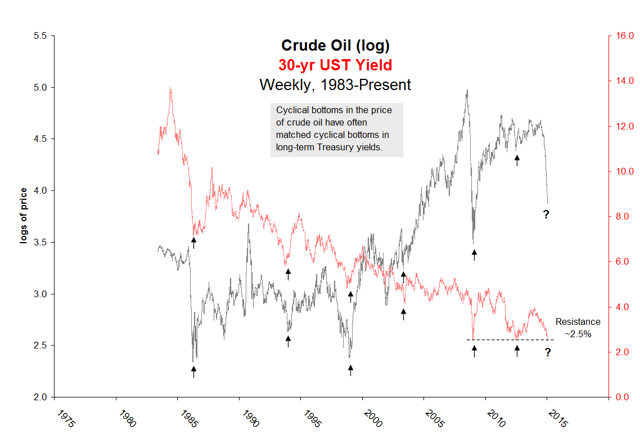
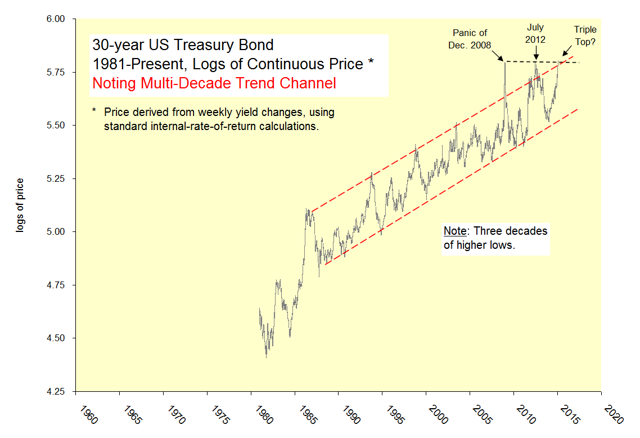
 Summary Important bottoms in crude oil have often matched important bottoms in Treasury yields. The bond market seems intrinsically stretched in context of its multi-decade progression. Long-term bonds are especially risky during the late stages of oil-market crashes. While many factors influence the bond market, it’s worth noting that cyclical bottoms in oil prices (NYSEARCA: USO ) have often matched cyclical bottoms in long-term Treasury (NYSEARCA: TLT ) yields. The oil crashes ending in March 1986, December 1998 and December 2008 are especially noteworthy. In all three cases, bond holders were severely clobbered after the free fall in oil prices ended. With the long bond currently near six-year-old resistance, it’s worth contemplating the damage that might be inflicted upon a reversal in the price of crude. Chart of the week: Oil prices versus long-term Treasury yields (click to enlarge) The bonus chart below presents a long history of 30-year U.S. Treasury prices expressed on log scale for comparability across time. In addition to the precarious set-up versus oil, the bond market seems intrinsically stretched in context of its multi-decade progression. The rally since December 2013 is “too steep, too fast.” The long bond seems to at least need a breather, and again, please note the tendency for sharp sell-offs following rocket-ship ascents. Bonus chart: 30-year Treasury prices (click to enlarge) Recap Important bottoms in crude oil have often matched important bottoms in Treasury yields. The bond market is currently stretched in context of its multi-decade progression. Long-term bonds are especially risky during the late stages of oil-market crashes. At this juncture, the two markets should not be contemplated independently. Now that you’ve read this, are you Bullish or Bearish on ? Bullish Bearish Sentiment on ( ) Thanks for sharing your thoughts. Why are you ? Submit & View Results Skip to results » Share this article with a colleague Scalper1 News
Scalper1 News