CF Industries CF posted a loss of $ 30 million or 13 cents per share in the third quarter of 2016, as against a profit of $ 90 million or 39 cents per share recorded a year ago.
Barring one-time items, earnings were 13 cents per share for the quarter, down from 54 cents per share recorded a year ago. However, the figure beat the Zacks Consensus Estimate of 5 cents.
Sales declined roughly 26.7% year over year to $ 680 million in the quarter, and missed the Zacks Consensus Estimate of $ 780 million. Sales declined in the quarter due to reduced average selling prices across all segments.
Segment Review
Sales for the Ammonia segment plunged roughly 44.4% year over year to $ 145 million in the reported quarter. Ammonia sales volumes slumped 13.7% to 505,000 tons year over year due to higher production of urea and UAN at Donaldsonville, LA. Average selling prices declined 35.7% to $ 287 per ton owing to an increase in global nitrogen supply due to global capacity additions and reduced feedstock costs.
Sales for the Granular Urea segment dipped 2.3% year over year to $ 167 million. Average selling prices per ton for granular urea declined 36% to $ 203 per ton owing to higher global nitrogen supply, driven by global capacity additions along with reduced feedstock costs. Granular urea gross margin per ton decreased 38.4% to $ 15 million due to lower average selling prices and higher depreciation along with amortization related to the new Donaldsonville urea plant.
Sales in the UAN (urea ammonium nitrate solution) segment dropped 39.3% year over year to $ 212 million. UAN sales volume slipped 6.6% to 1,350,000 in the quarter due to delays in customer purchasing. UAN gross margin per ton fell due to lower average selling prices and higher depreciation along with amortization related to the new Donaldsonville UAN plant.
Sales in the AN (ammonium nitrate) segment surged 28.8% year over year to $ 103 million. Sales volumes soared 72.6% due to the addition of CF Fertilizers UK sales. AN gross margin per ton rose mainly due to lower production and purchased natural gas costs, as well as lower unrealized net mark-to-market losses.
The Other segment’s sales fell 20.1% year over year to $ 53 million. Sales volumes were 31% higher in the reported quarter. Other segment average selling price per ton decreased 39.8% due to $ 136 per ton due to higher global nitrogen supply driven by capacity additions.
Financials
CF Industries’ cash and cash equivalents were $ 1,554 million, climbing roughly 64.8% year over year. Long-term debt was $ 5,540 million, inching down 0.9% year over year.
Outlook
For 2016, the company expects total capital expenditures of about $ 2.3 billion, of which roughly $ 1.8 billion will be for the capacity expansion projects and $ 450 million to $ 475 million will be for sustaining, improvement and other projects.
The company noted that the agricultural outlook for North America suggests sustained profitability at the farm level for corn and soybeans notwithstanding less profitable acreage in the Western Cornbelt and Southeast. Consequently, planted acres for corn are expected to fall to about 88 million acres in 2017 vis-à-vis about 94 million acres planted in 2016.
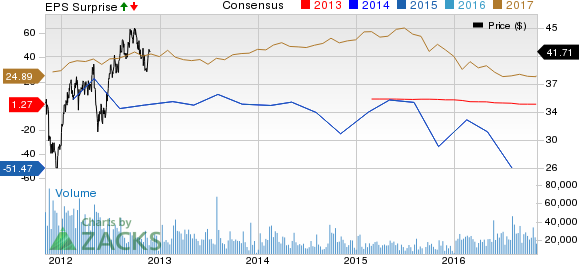
CF INDUS HLDGS Price, Consensus and EPS Surprise
CF INDUS HLDGS Price, Consensus and EPS Surprise | CF INDUS HLDGS Quote
Zacks Rank
CF Industries currently carries a Zacks Rank #5 (Strong Sell).
Some better-ranked companies in the basic materials space include Newmont Mining Corporation NEM , New Gold Inc. NGD and Pershing Gold Corporation PGLC all carrying a Zacks Rank #2 (Buy). You can see the complete list of today’s Zacks #1 (Strong Buy) Rank stocks here .
Newmont has an expected earnings growth rate of 82.8% for the current year.
New Gold has an expected earnings growth rate of 483.3% for the current year.
Pershing Gold has an expected earnings growth rate of 26.3% for the current year.
Confidential from Zacks
Beyond this Analyst Blog, would you like to see Zacks’ best recommendations that are not available to the public? Our Executive VP, Steve Reitmeister, knows when key trades are about to be triggered and which of our experts has the hottest hand. Click to see them now>>
Want the latest recommendations from Zacks Investment Research? Today, you can download 7 Best Stocks for the Next 30 Days. Click to get this free report
CF INDUS HLDGS (CF): Free Stock Analysis Report
NEWMONT MINING (NEM): Free Stock Analysis Report
NEW GOLD INC (NGD): Free Stock Analysis Report
PERSHING GLD CP (PGLC): Free Stock Analysis Report
The views and opinions expressed herein are the views and opinions of the author and do not necessarily reflect those of Nasdaq, Inc.
Plantations International
