Scalper1 News


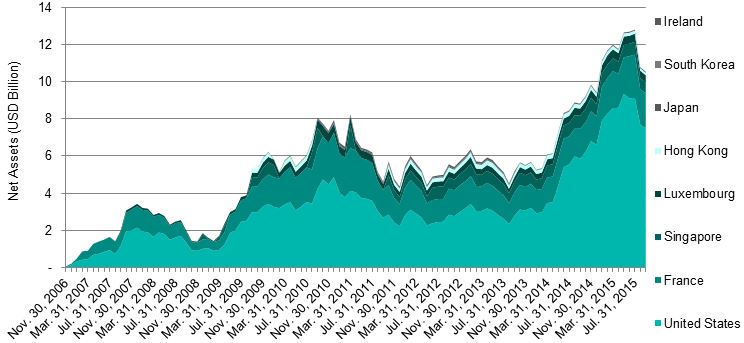
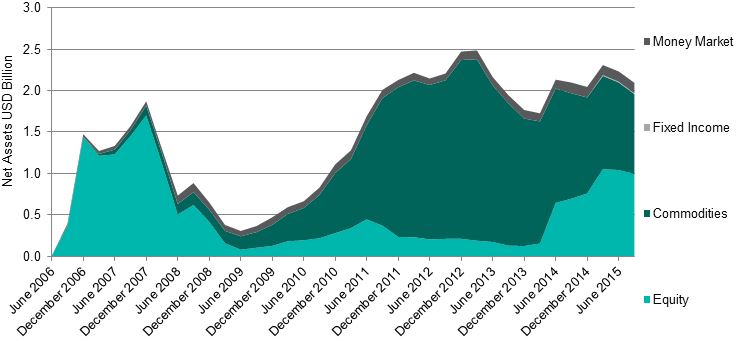
 By Utkarsh Agrawal Since the introduction of ETFs, the dynamics of investing has changed dramatically. Apart from being more transparent, with lower costs and improved tax efficiency, ETFs have helped create the opportunity for smaller investors to access asset classes previously available only to institutional investors. Emerging markets tend to be riskier than developed markets, but can also offer diversification opportunities. With emerging market ETFs, it has become possible to incorporate the objectives and constraints of investors who desire exposure to emerging markets in their portfolio construction process. Among emerging markets, India has been one of the preferred countries. The assets under management (AUM) and the number of the ETFs that provide exposure to India have increased tremendously. All of these ETFs are based on Indian equities. As of July 2015, there were 27 of them, with combined AUM of USD 12.80 billion, domiciled across seven countries (see Exhibit 1). The U.S. has been the greatest contributor in terms of both AUM and the number of ETFs, followed by France, Singapore, and other countries. Since August 2015, the combined AUM has decreased by more than USD 2.27 billion, amounting to a decline of almost 18%, and it stood at USD 10.53 billion as of September 2015. This reduction in AUM has also contributed to the volatility of the equity market and the exchange rate in India. Exhibit 1: International Equity ETFs That Provide Exposure to India Source: Morningstar. Data as of Sept. 30, 2015. Chart is provided for illustrative purposes. As opposed to the international Indian ETFs, India’s domestic ETFs are not only limited to equities. They also include commodities, fixed income investments, and money markets (see Exhibit 2). As of September 2015, the total number of domestic ETFs was 51, and the combined total AUM stood at USD 2.09 billion. The proportion of domestic equity ETFs in the combined total AUM was almost 48%, at USD 1.00 billion as of September 2015. The AUM of the domestic equity ETFs in India account for just 10% of that of the international equity ETFs that provide exposure to India. The recent rise in AUM of India’s domestic equity ETFs can be attributed to the introduction of the Central Public Sector Enterprise (CPSE) ETF, as well as the investment by the Employees’ Provident Fund Organization (EPFO). The Central Board of Trustees (CBT), the apex decision-making body of the EPFO, has recently decided to invest in India’s domestic equity ETFs within the prescribed limit of 5%-15% of the total corpus. Exhibit 2: Domestic ETFs in India Source: Morningstar, Association of Mutual Funds in India and Reserve Bank of India. Data as of Sept. 30, 2015. Chart is provided for illustrative purposes. The S&P BSE SENSEX , India’s heavily tracked bellwether index, is designed to measure the performance of the 30 largest, most-liquid, and financially sound companies across key sectors of the Indian economy. As of September 2015, it has served as the underlying index to one international equity ETF, which provides exposure to India, and five domestic Indian equity ETFs. Over the past 10 years, ending in September 2015, the S&P BSE SENSEX has yielded an annualized total return of 13.32% in Indian rupees (see Exhibit 3). Apart from domestic Indian equity ETFs based on other indices, the EPFO will also invest in the domestic S&P BSE SENSEX ETF, leading to expectations of a further boost to the AUM of this established index. Source: S&P Dow Jones Indices. Data as of Sept. 30, 2015. Chart is provided for illustrative purposes. Past performance is no guarantee of future results. Disclosure: © S&P Dow Jones Indices LLC 2015. Indexology® is a trademark of S&P Dow Jones Indices LLC (SPDJI). S&P® is a trademark of Standard & Poor’s Financial Services LLC and Dow Jones® is a trademark of Dow Jones Trademark Holdings LLC, and those marks have been licensed to S&P DJI. This material is reproduced with the prior written consent of S&P DJI. For more information on S&P DJI and to see our full disclaimer, visit www.spdji.com/terms-of-use . Scalper1 News
Scalper1 News