Scalper1 News


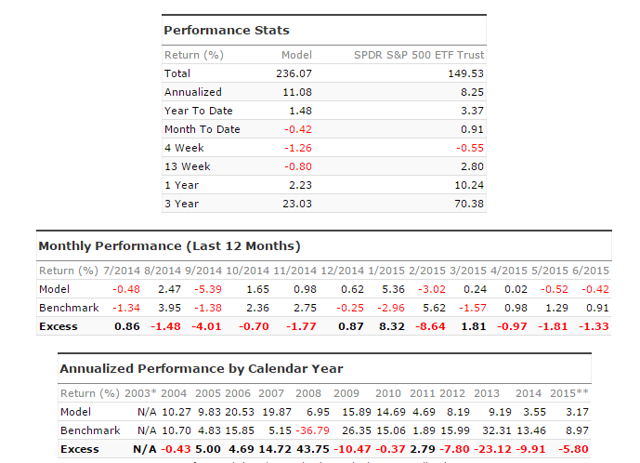
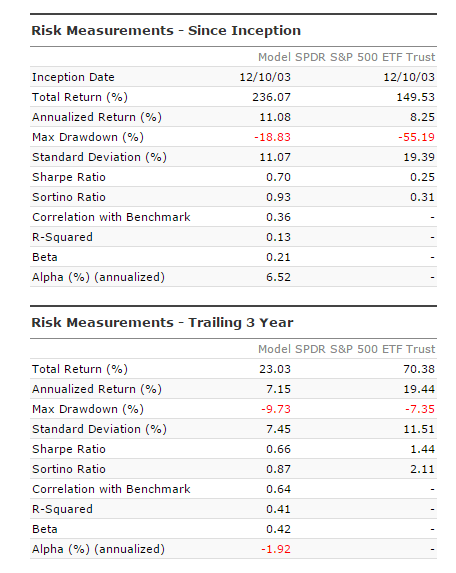
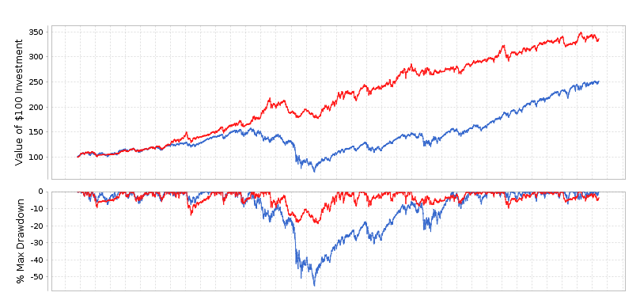
 Independent research, long/short equity, dividend investing, ETF investing “}); $$(‘#article_top_info .info_content div’)[0].insert(bottom: $(‘mover’)); } $(‘article_top_info’).addClassName(test_version); } SeekingAlpha.Initializer.onDOMLoad(function() setEvents();); My previous article detailed backtest results for the ETFReplay.com portfolio. Aggregate, risk-adjusted results since 2004 were impressive when compared to a 60/40 Vanguard mutual fund. However, results over the past 2-3 years lagged the benchmark. The test below was conducted using Portfolio123 (“P123″). It uses a similar ranking system to the ETFReplay 6/3/3 system but has a few seemingly “minor” differences: The P123 begins with a similar basket of ETFs, the only difference is the P123 system ranks 15 ETFs instead of 14, with the PowerShares DB Agriculture ETF (NYSEARCA: DBA ) as the extra ETF. The starting date for the P123 test is 12/10/03, which differs from the ETFReplay start date of 1/1/2004. The P123 system rebalances every 4 weeks, instead of at the end of each month. The ETFReplay test assumes equal holdings each month (i.e. rebalancing back to equal weight each month at no cost) while P123 lets positions run so holdings may become unbalanced over time. The P123 test uses the next days closing price of each ETF for the transaction price, compared to the ETFReplay system which uses the same days closing price when each ETF is ranked. Finally, and perhaps most importantly, the P123 test accounts for slippage with each transaction, which reduces returns. The slippage for each transaction is calculated based on the average trading volume for each ETF. This is a conservative method for calculating ETF slippage. After accounting for these differences, we see the P123 test shows significantly lower results (as an aside, the benchmark for this test was the SPDR S&P 500 Trust ETF ( SPY)): Tables and charts courtesy of Portfolio123 (click to enlarge) (click to enlarge) However, if we assume zero slippage results improve dramatically. Total and annualized return are significantly higher yet we still see different returns and risk metrics than the ETFReplay test. This can be attributed to a slightly different pool of ETFs, and different rebalancing dates/methodology: (click to enlarge) (click to enlarge) The point of this exercise is not to disparage backtests or historical results. Rather, it shows the importance of considering trading costs as well as how changes in test parameters can impact results. Focus on making your tests robust. Run them through multiple time frames with different assumptions and be mindful of data-mining. Finally, be conscious of trading costs and fees! Many brokers now offer commission free ETFs, but taxes and trading slippage can take a big bite out of returns. Disclosures: None Share this article with a colleague Scalper1 News
Scalper1 News