Scalper1 News
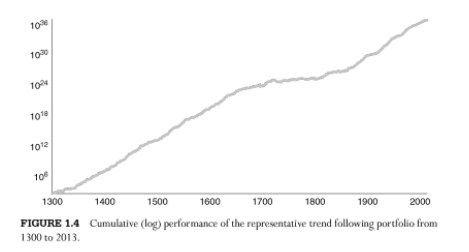
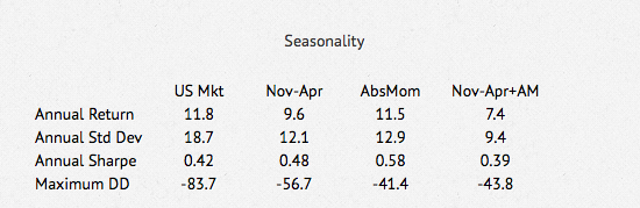 Until recently, the longest back test using stock market data was Geczy and Samonov’s 2012 study of relative strength momentum called “212 Years of Price Momentum: The World’s Longest Backtest: 1801-2012”. The length of that study has now been exceeded by an 800 year backtest of trend following absolute momentum in Greyserman and Kaminski’s new book, Trend Following with Managed Futures: The Search for Crisis Alpha . The authors looked at 84 equities, fixed income, commodities, and currencies markets as they became available from the years 1200 through 2013. They established long or short equal risk sized positions based on whether prices were above or below their 12-month rolling returns. The annual return of this strategy was 13% with an annual volatility of 11% and a Sharpe ratio of 1.16. Anyone who had doubts about the long-run efficacy of trend following momentum should no longer be doubtful. However, let’s not just look at trend following on its own. Let’s also compare it to other possible risk reducing or return enhancing approaches and see what looks best. We will base our comparisons on the performance of U.S. equities because that is where long-run risk premium and total return have been the highest. We also have U.S. stock market data available from the Kenneth French data library all the way back to July 1926. We will compare trend following to seasonality and then to the style and factor-based approaches of value, growth, large cap, and small cap. We will also see if it makes sense to combine these with trend following. For seasonality, we look at the Halloween effect, sometimes called “Sell in May and go away…” This has been known to practitioners for many years. There have also been a handful of academic papers documenting the positive results of holding U.S. stocks only from November through April. The following table shows the results of this strategy compared with absolute momentum applied to the broad U.S. stock market from May 1927 through December 2014. With 10-month absolute momentum, we are long stocks when the excess return (total return less the Treasury bill rate) over the past 10 months has been positive.[1] Otherwise, we hold Treasury bills. We also hold Treasury bills when we are out of U.S. stocks according to the Halloween effect (in stocks November-April, out of stocks May-October). We see that the 6-month seasonal filter of U.S. stock market returns substantially reduces volatility and maximum drawdown, but at the cost of reducing annual returns by over 200 basis points. Trend following absolute momentum, on the other hand, gives a greater reduction in maximum drawdown than seasonality with almost no reduction in return. There is no reason to consider seasonal filtering when absolute momentum gives a greater reduction in risk without diminished returns. The table below shows the U.S. market separated into the top and bottom 30% based on book-to-market (value/growth) and market capitalization (small/large). We see that value and small cap stocks have the highest returns but also the highest volatility and largest maximum drawdowns. Style US Mkt Value Growth Large Small Annual Return 11.8 16.2 11.3 11.5 16.6 Annual Std Dev 18.7 25.1 18.7 18.1 29.3 Annual Sharpe 0.42 0.46 0.39 0.42 0.41 Maximum DD -83.7 -88.2 -81.7 -82.9 -90.4 Most academic studies ignore tail risk/maximum drawdown, but these can be very important to investors. Not many would be comfortable with 90% drawdowns.[2] On a risk-adjusted basis (Sharpe ratio), neither small cap nor value stocks appear much better than growth or large cap stocks. This is consistent with the latest academic research showing no small size premium and a value premium associated only with micro cap stocks.[3] Let’s now see what happens now when we apply absolute momentum to these market style segments: Style w/Absolute Momentum AbsMom ValAbsMom GroAbsMom LgAbsMom SmAbsMom Annual Return 11.5 13.3 10.3 11.5 13.9 Annual Std Dev 12.9 17.2 13.3 12.5 21.1 Annual Sharpe 0.58 0.53 0.48 0.60 0.46 Maximum DD -41.4 -66.8 -42.3 -36.2 -76.9 In every case, adding absolute momentum reduces volatility, increases the Sharpe ratio, and substantially lowers maximum drawdown. The biggest impact of absolute momentum, however, is on large cap stocks, followed by the overall market index. The use of a trend following absolute momentum overlay further reduces the relative appeal of value or small cap stocks. We may wonder why large cap stocks respond better to trend following. The answer lies in a study by Lo and MacKinlay (1990) showing that portfolio returns are strongly positively autocorrelated (trend following), and that the returns of large cap stocks almost always lead the returns of small cap stocks. Since trend following lags behind turns in the market, investment results should be better if you can minimize that lag by being in the segment of the market that is most responsive to changes in trend. That segment is large cap stocks, notably the S&P 500 index, since they lead the rest of the market. In my book, Dual Momentum Investing: An Innovative Strategy for Higher Returns with Lower Risk , I give readers an easy-to-use, powerful strategy incorporating relative strength momentum to select between U.S. and non-U.S. stocks and absolute momentum to choose between stocks or bonds. I call this model Global Equities Momentum (GEM). And what index is the cornerstone of GEM? It’s the S&P 500, the one most responsive to trend following absolute momentum and that gives the best risk-adjusted results. Einstein said you should keep things as simple as possible, but no simpler. One can always create more complicated models or include more investable assets. But as we see here, trend following momentum is best when it is simply applied to large cap stocks. [1] We use 10-month absolute momentum instead of the more popular 10-month moving average because absolute momentum gives better results. See our last blog post, ” Absolute Momentum Revisited “. [2] The next largest maximum drawdown was 64.8 for value and 69.1 for small cap on a month-end basis. Intramonth drawdowns would have been higher. [3] See Israel and Moskowitz (2012) for empirical results. Delisting bias and high transaction costs can also reduce any small cap premium. Results are hypothetical, are NOT an indicator of future results, and do NOT represent returns that any investor actually attained. Indexes are unmanaged, do not reflect management or trading fees, and one cannot invest directly in an index. Please see our Disclaimer page for more information. Scalper1 News
Scalper1 News